I always enjoy my trips to Omaha. A long time ago, I met a fellow there named Mike Moore. Mike is passionate about data. Years ago, I offered to help him start a Tableau user group in Omaha. GOTUG is now a very successful user group. This week, I followed Dewey Heffelfinger. Dewey showed some obsessively-detailed golf dashboards from a tournament he’s been doing for years with friends, featuring everything you might want to know about scoring and handicaps down to specific hole statistics. I also learned a different way to build box plots from Dewey.
InterWorks teammate Mark Bingham who lives in Omaha also attended the meeting.
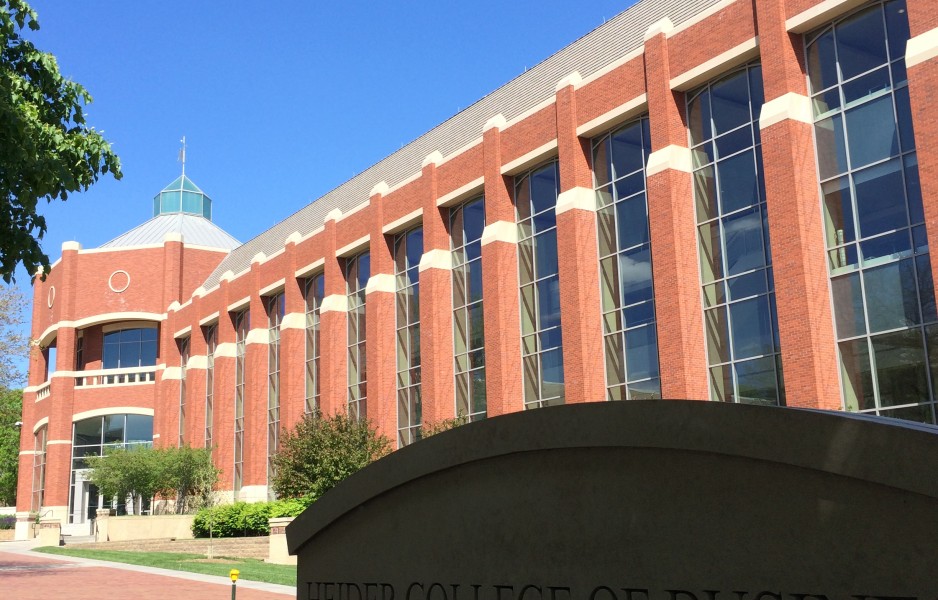
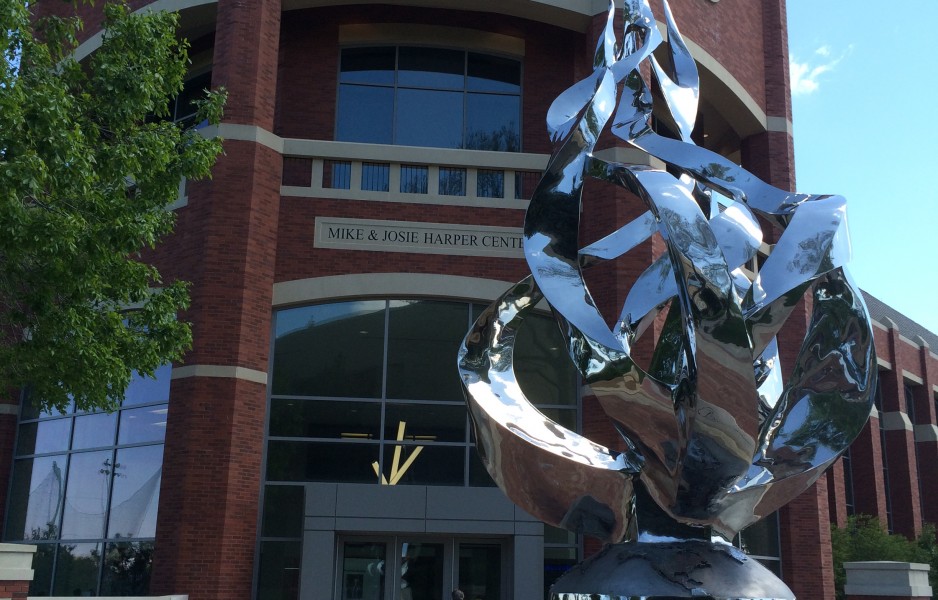
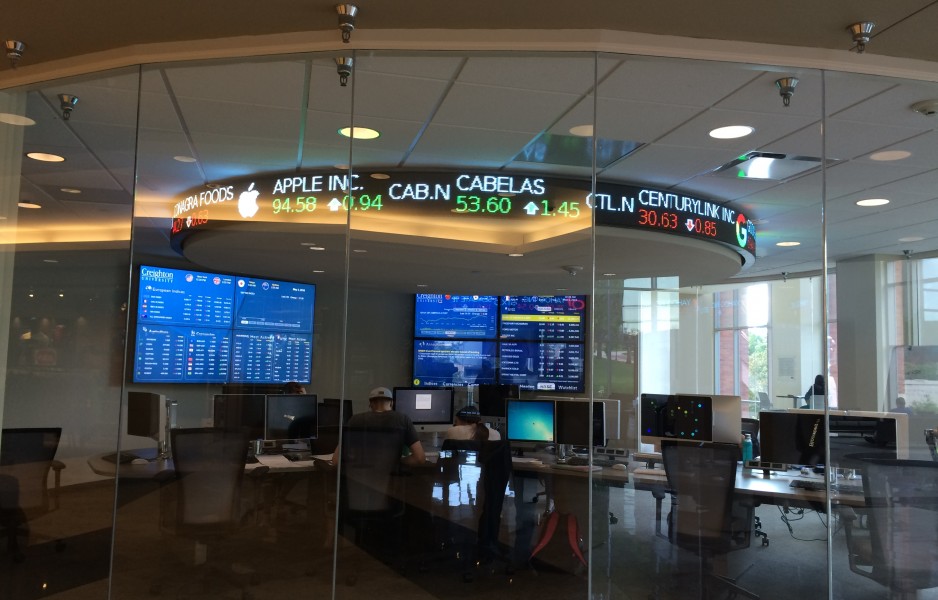
Thank you to Creighton Universities’ Heider College of Business for hosting the talk. If you are ever in Omaha, I urge you to visit and check out the Heider Business School. They have one of the coolest securities analysis rooms that I’ve seen at any university in the country.
Below is my slide deck from the presentation followed by the relevant files:
Add Comment
- Big Trends in Data 1980 to Now
- Data Interpreter START Workbook
- Data Interpreter FINISHED Workbook
- Forecasting Workbook
- Dashboard Discovery Workbook
- Superstore for TYD2 XLSX
- CitiBikes TDE & TWBX
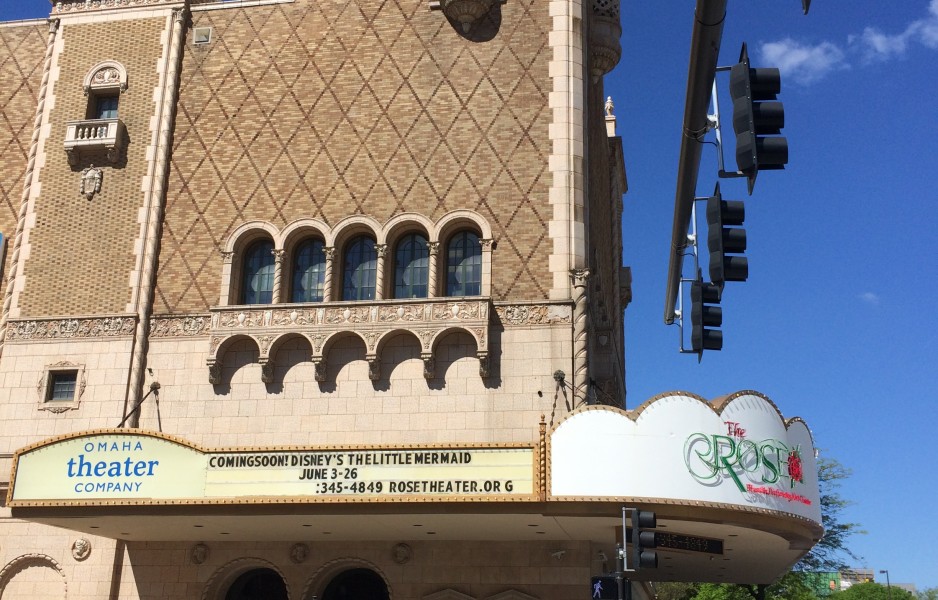
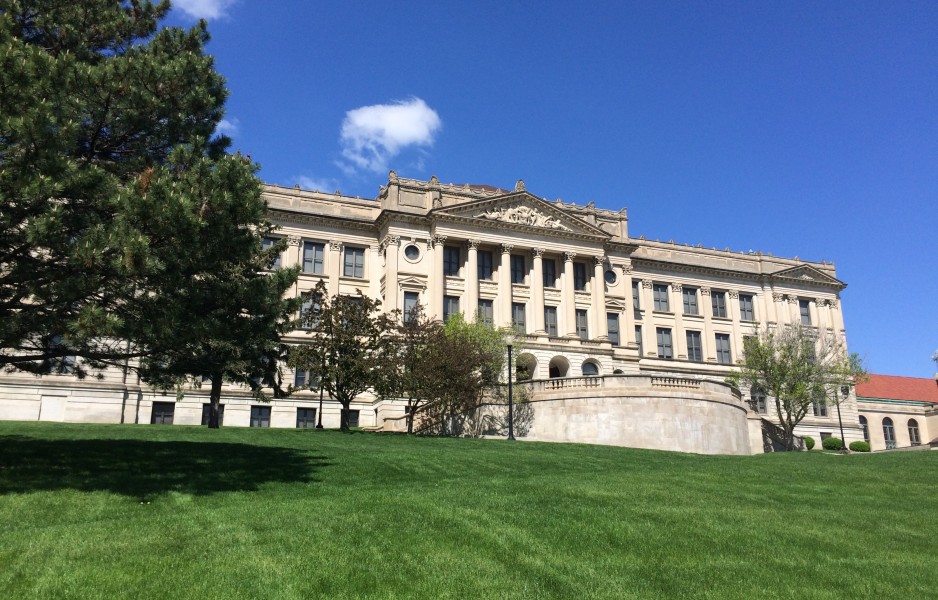
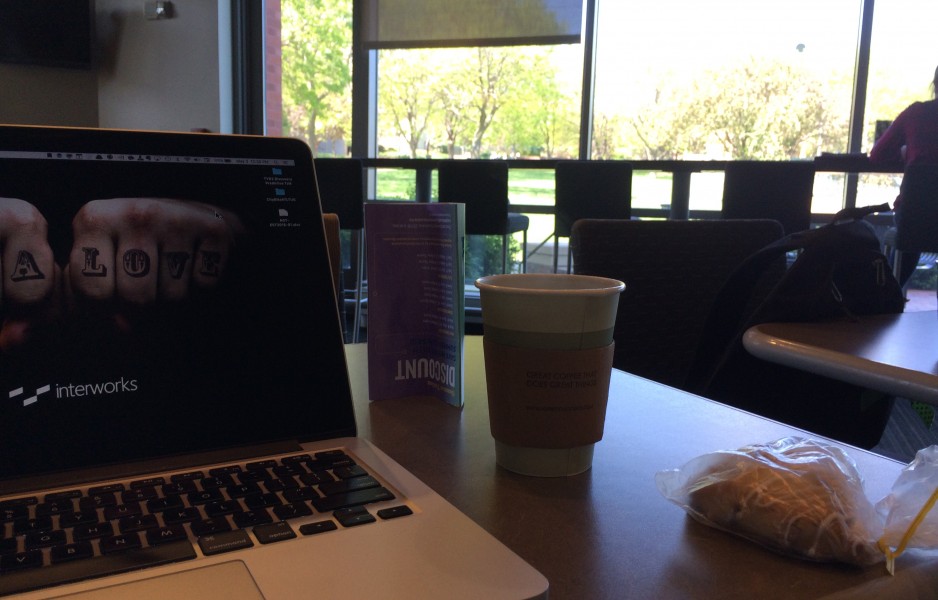
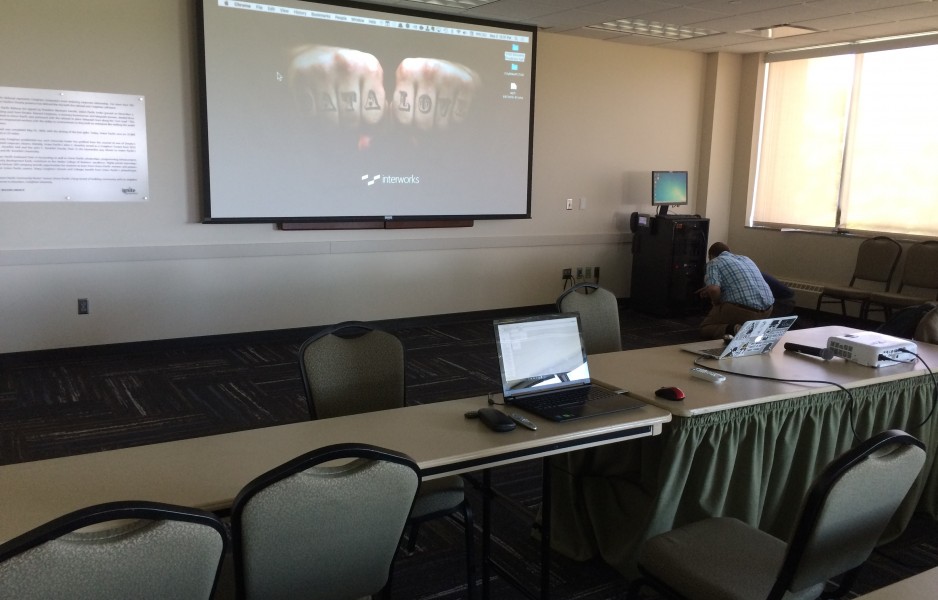
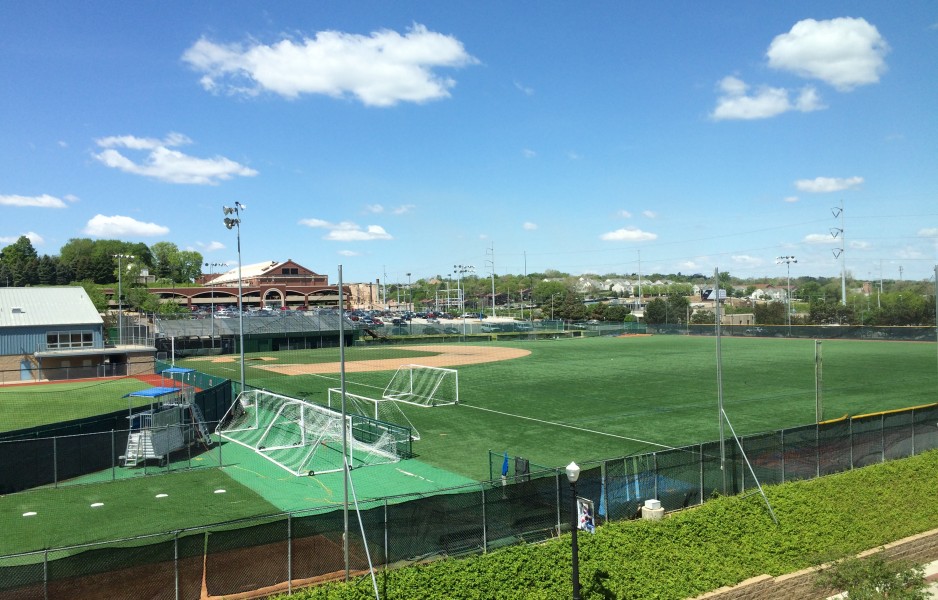
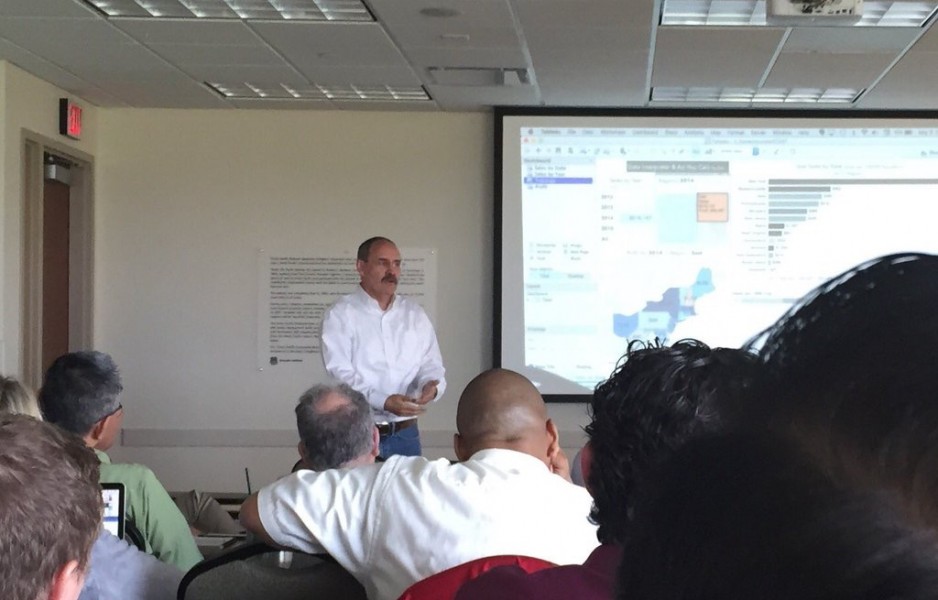
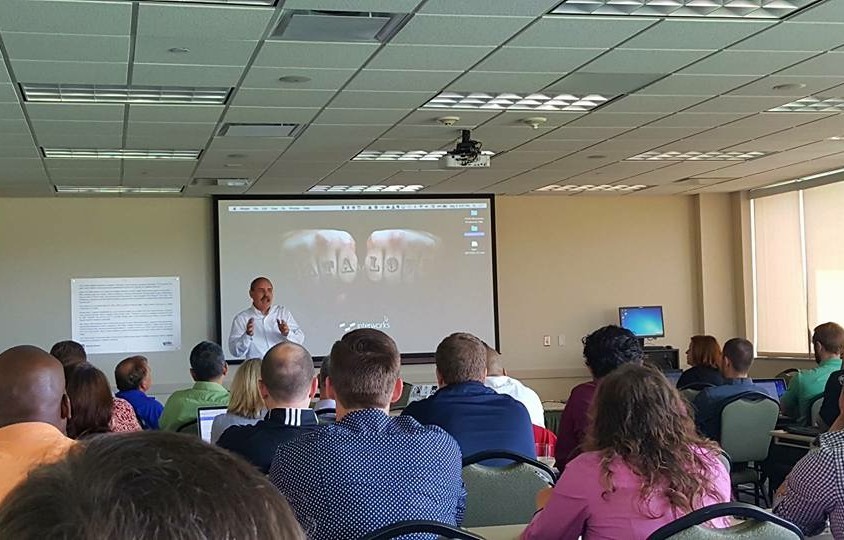
Here are a few photos: