Deploying Tableau at a Large Social Media Company
This case study was provided by Facebook’s Andy Kriebel. You may know Andy from his excellent blog on data visualization–VizWiz, Data Visualization Done Right. http://vizwiz.blogspot.com/
Big Data at Facebook
“Having all of this data is great, yet big data really is about having insights and making an impact on your business. If you aren’t taking advantage of the data you’re collecting, then you just have a pile of data. You don’t have big data.” Jay Parikh, Facebook VP of Engineering
Big data is a new buzz word. But how many companies truly have big data? The term is relative, of course, yet no one can argue that Facebook has some of the biggest data in the world. For instance:
- A single Hadoop cluster is over 100 petabytes
- Facebook collects over 500 terabytes of data daily
- The Facebook servers scan over 200 terabytes every hour
- One daily partition of the Facebook “Users” table is over 5.5 billion records
The goal of the Business Information (BI) team at Facebook is to enable a cycle of analysis that allow team members to take advantage of this data. Figure 1 illustrates the cycle of analysis at Facebook.
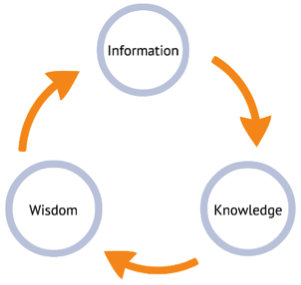
Figure 12-2: Facebook Cycle of Analysis
Stephen Few explains this process well.
“Information cannot speak for itself. It needs our help. It relies on us to give it a voice. When we do, information can tell its story, and will thus become knowledge. Then it can be used to do something good. Only when we use what we know to make the world a better place has information served its purpose and we have done our job.” Stephen Few, Perceptual Edge
Tableau has helped Facebook create an environment that supports this cycle of analysis through rapid-fire analytics. Facilitating the Tableau deployment at Facebook involves these areas:
- Architecture
- People
- Training and Collaboration
- Data visualization
Architecture to Promote Data Quality Without Obstruction
Controlling the promotion of user-created dashboards while ensuring the quality of the information is of primary concern. Since Tableau lacks a semantic layer, each user can define key metrics however they see fit. This can lead to incorrect or contradictory reports. The project taxonomy that has been adopted at Facebook is a two-tiered promotion model (certified and uncertified reports) that share the same physical hardware.
The uncertified area serves as a safe sandbox for end users. Objects will be promoted to the certified area only after they are reviewed by a member of the BI team. Comprehensive reviews cover the data model, workbook and dashboard performance and visualization standards/best practices. Figure 2 shows the project taxonomy.
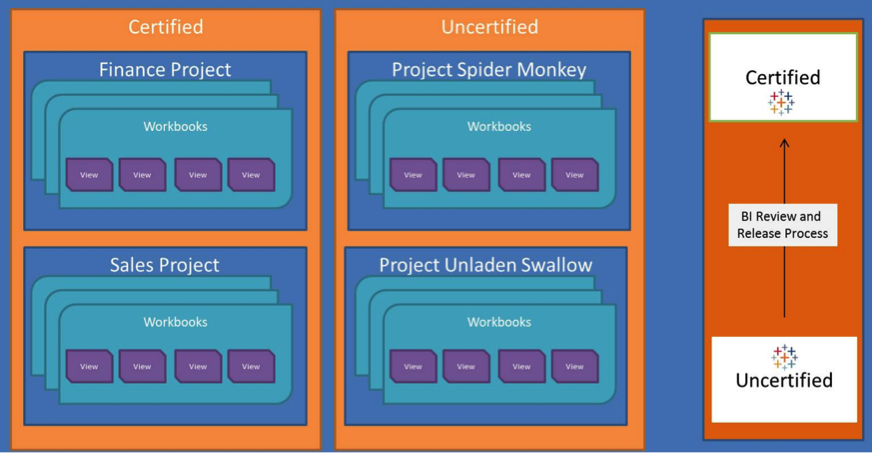
Figure 2: Facebook’s Project Taxonomy
The basic server processes that power Tableau at Facebook include:
- Gateway (32 bit)—Load Balancer
- Search (32 bit)—Indexes repository
- App Server (32 bit)—Web UI, Security, Navigation
- VizQL (32 bit)—Main application engine, does everything related to views and dashboards
- Data Server (32 bit)—Loads cache with data requests, manages semantic layer (metadata layer)
- Backgrounder (32 bit)—Handles background refreshes and tasks (e.g., Extract Refreshes and AD Sync jobs)
- Data Engine (64 bit)—Proprietary DB engine for Tableau Server Extracts
- Repository (32 bit)—Metadata for all Tableau Server Objects
This taxonomy and architectural structure have allowed Facebook to scale resources and successfully meet user demand as their user base grows.
Applying Facebook’s Social Mission to the Tableau Deployment
As the world’s largest social network, Facebook is focused on people, their interactions, building relationships and making the world more open and connected. This mission also applies internally to everything they do at Facebook, including deploying new technologies. In order to make Tableau a success, Facebook hires the best and brightest talent in the world.
By contracting with an experienced consulting partner and also hiring full-time staff that are dedicated to getting Tableau physically installed, architected properly and providing initial training, Facebook is able to support hundreds of new desktop users effectively and achieve high return on investment. Figure 3 shows the team structure.
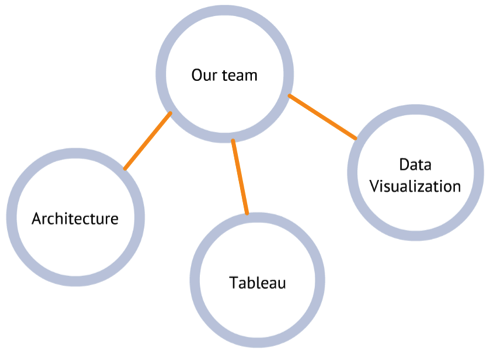
Figure 3: Team Structure
Training and Collaboration
Like most organizations, BI at Facebook was initially very centralized, with a few people processing all of the reporting and analytical requests for the entire organization. This is not an efficient operating model if you truly want to gain insights from your data. Everyone at Facebook is expected to tackle the biggest problems.
In order for that to happen, Facebook needed a comprehensive and holistic program that would eliminate the roadblock of the BI team and provide a platform that enables everyone in the company to be an analyst. Figure 4 shows Facebook’s comprehensive platform for success.
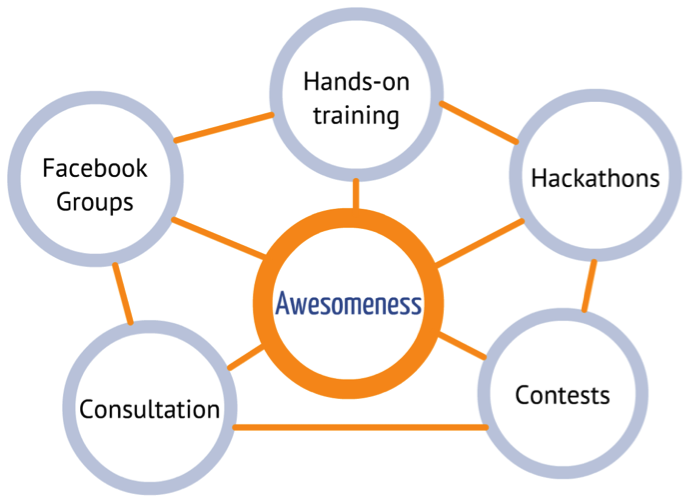
Figure 4: Facebook’s Platform for Success
Training for Excellence
Tableau is an incredibly intuitive tool, but Facebook wants to provide a richer experience aimed toward creating the most sophisticated user base in the world. To do this, weekly training sessions are provided. At the end of a one-hour session, users are able to create dashboards like the one you see in Figure 5.
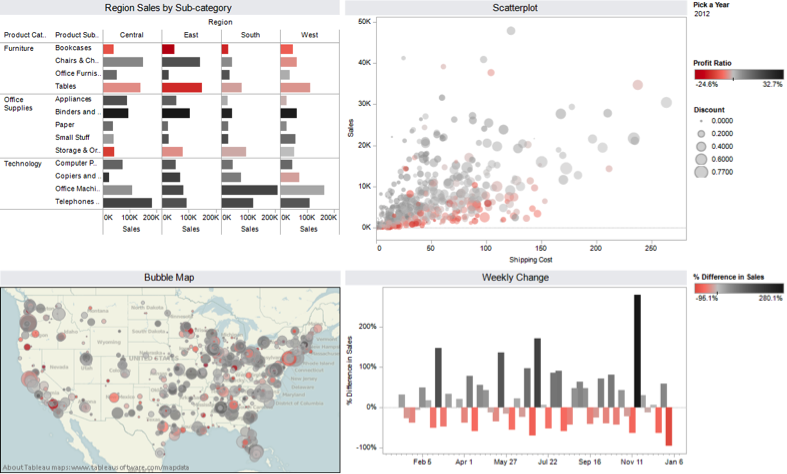
Figure 5: Training Class Dashboard
Every other week they conduct an introductory session which covers getting set up with Tableau, connecting to data and basic chart types. In the alternate weeks, they learn about a wide variety of advanced topics including:
- Parameters
- Actions
- Guided analytics
- Advance chart types
- Filtering and sorting
- Grouping and sets
- Building maps
Figure 6 is an example of the kind of dashboard students build in an advanced training class.
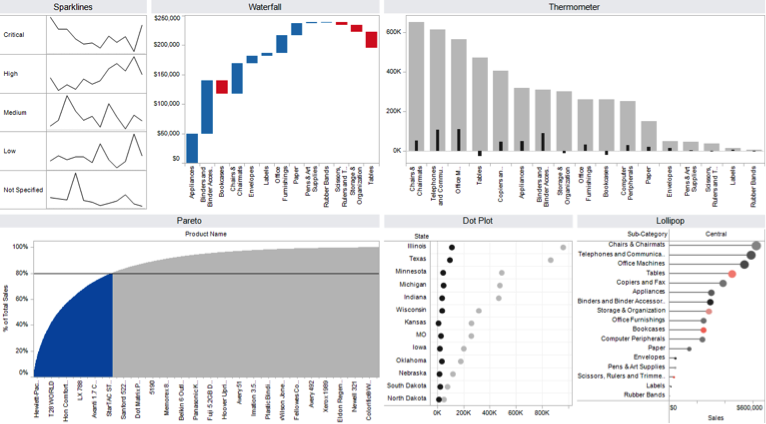
Figure 12-7: Advanced Class Dashboard [612040 c12f007.png]
The dashboard example in Figure 12–7 incorporates a sparkline, waterfall chart, a thermometer (bar-in-bar) chart, a Pareto chart and a lollipop chart. All of these are easy to build once the techniques are understood. As Facebook is still nurturing its Tableau community, these sessions continue to be immensely helpful.
Fostering Collaboration Between Team Members
Facebook has internal groups for everything they do — products, teams, new launches and even for their chefs posting the daily meals. They have built a very active Tableau community on the Facebook website. On their group page, they post important updates regarding their database, servers, upgrades and other maintenance issues. This is also the forum where users post questions. Figure 7 shows typical Tableau user questions.
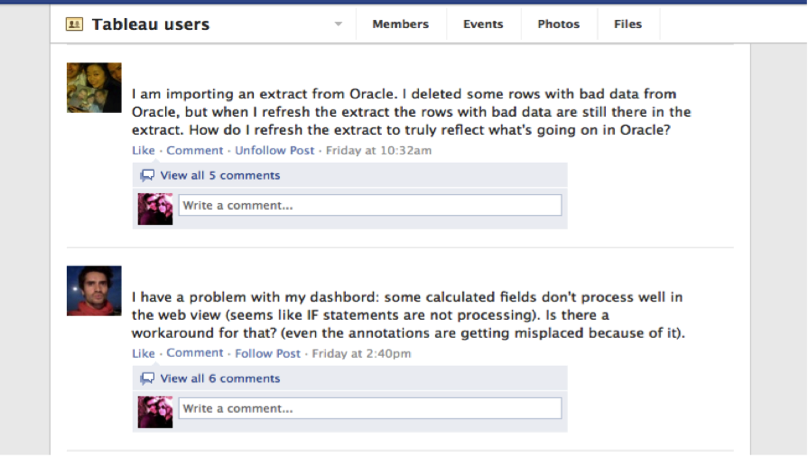
Figure 7: Tableau Group Questions
This group reduces e-mail to core Tableau resources and provides a repository of knowledge. The entire group learns from this repository and often, people who have been trained are able to answer questions in this venue.
Applying Data Visualization Best Practices
It is critical that people are well versed in Tableau. And yes, Tableau makes creating nice looking charts and graphs easy. However, that’s not enough for Facebook. They want users to have a deep understanding of data visualization best practices so that their designs conform to their standards and expectations, They also wish to teach users how to communicate data most effectively. The course content covers:
- Brain games
- Basics of visual perception
- Forms of pre-attentive processing
- Gestalt principles
- 16 basic chart types and when to use them
Training is most effective when the examples and situations that are covered use Facebook data, which helps make the material stick and allows them to see how they can apply the principles immediately. In addition to their internal training, they invite industry experts to speak to trainees. Recent speakers included Andy Kirk, Alberto Cairo and Drew Linzer.
Summary of Achievements to Date
Over 250 people have received training on data visualization best practices, and over 750 people have attended Tableau training sessions at Facebook. This participation has been phenomenal. Figure 8 is a Tableau dashboard that shows the progression of Tableau at Facebook.
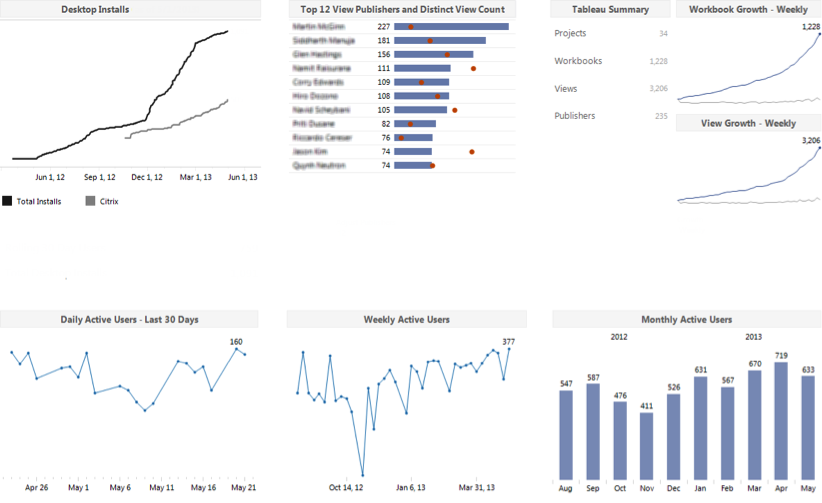
Figure 8: Tableau Usage at Facebook
Facebook’s success with Tableau has been the result of following the principles in the bullet points:
- Hire the best and brightest. Without top talent, you won’t be as successful.
- Find champions for your cause. Identify someone senior in the organization that believes in Tableau. Find a project to use Tableau; share it and you’ll be on your way. Tableau will quickly become an integral part of your organization.
- Be bold. Don’t be afraid to take risks. It’s important to fail. Without failing, you won’t learn.
- Be open with your data. At Facebook, nearly all data that is used in Tableau is available for consumption by anyone in the organization, with the exception of data about users, HR data and some revenue data.
Facebook Business Information Team leaders expect the growth of Tableau to continue on its current trajectory. They have long-range plans to support this growth, from both architectural and training perspectives, and Facebook will continue to build a more self-sufficient community of users.