Best practices and step-by-step instructions for using the Tableau Software toolset
Although the Tableau Desktop interface is relatively intuitive, this book goes beyond the simple mechanics of the interface to show best practices for creating effective visualizations for specific business intelligence objectives. It illustrates little-known features and techniques for getting the most from the Tableau toolset, supporting the needs of the business analysts who use the product as well as the data and IT managers who support it.
This comprehensive guide, now in its 2nd edition, covers the core feature set for data analytics, illustrating best practices for creating and sharing specific types of dynamic data visualizations current with Tableau 9.2. Featuring a helpful full-color layout, the book covers analyzing data with Tableau Desktop, sharing information with Tableau Server, understanding Tableau functions and calculations, and use cases for Tableau Software. Now Available!

“Tableau can help you answer questions with data. We hear stories daily about how people use Tableau to help increase sales, streamline operations, improve customer service, manage investments, assess quality and safety, study and treat diseases, pursue academic research, address environmental problems and improve education.
My hope is that this book can accelerate your adoption of Tableau.“
Tableau CEO & Co-Founder
[foreword from Tableau Your Data! 1st Edition]
What You’ll Learn
Why and how Tableau differs from traditional business information analysis tools
How to connect to data in Tableau, build engaging visualizations and utilize Tableau’s mapping features
Little-known, as well as more advanced features and techniques, based on real-world applications seen in the author’s consulting and training practice
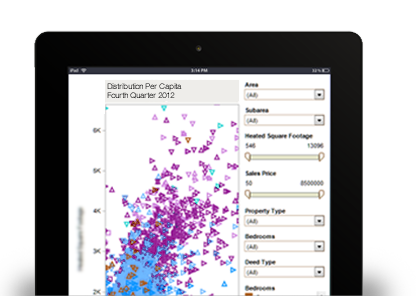
How to effectively utilize stories in Tableau and design dashboards for mobile consumption
How to deploy dashboards throughout the enterprise via Tableau Server
How to create an ad hoc environment for analysis and data discovery using Tableau and the Data Interpreter
Provides a detailed reference resource that is aimed at users of all skill levels
Purchase Your Copy
Tableau Your Data! shows you how to build dynamic, best-of-breed visualizations using the Tableau Software toolset.ORDER NOW!![]()
![]()
Book Details:
Publication Date: January 2016
ISBN-10: 1119001196
ISBN-13: 978-1119001195
Edition: 2 | Paperback: 784 pages
Publisher: Wiley
About the Author

Dan Murray
With over 30 years of diverse, global business experience, Dan founded the Tableau/BI practice at InterWorks. Dan has been actively engaged in helping people realize benefits using Tableau for over seven years and has twice been a speaker at Tableau’s annual conference. His contributions to the Tableau community have earned him the title of Tableau Zen Master.
Dan has worked with clients like Facebook, Cisco, Paypal, Citrix, Carnegie Mellon University, the Federal Reserve, and the FDIC, and also co-founded the first Tableau User Group in the United States.