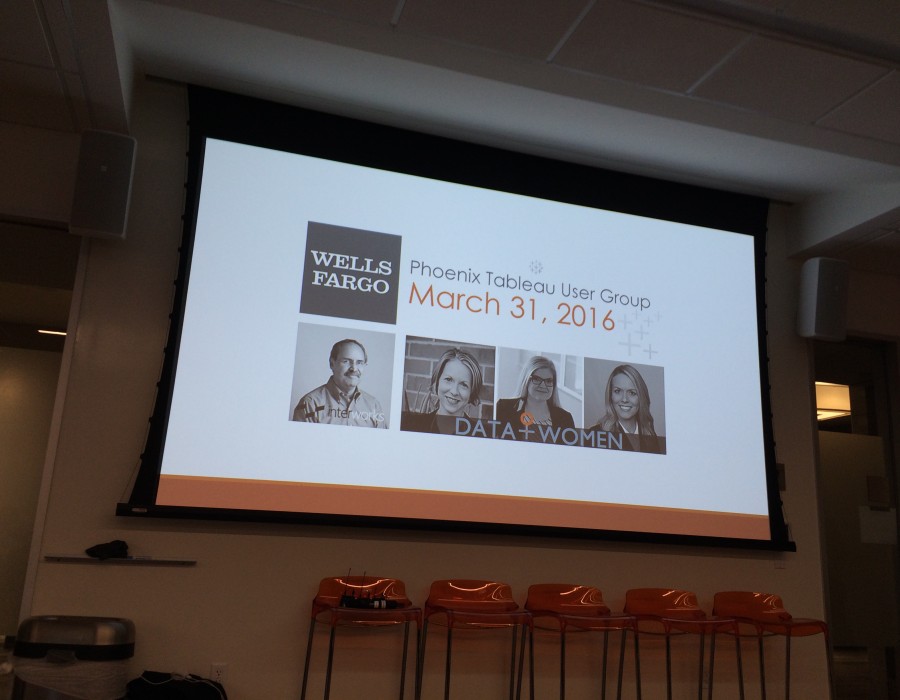
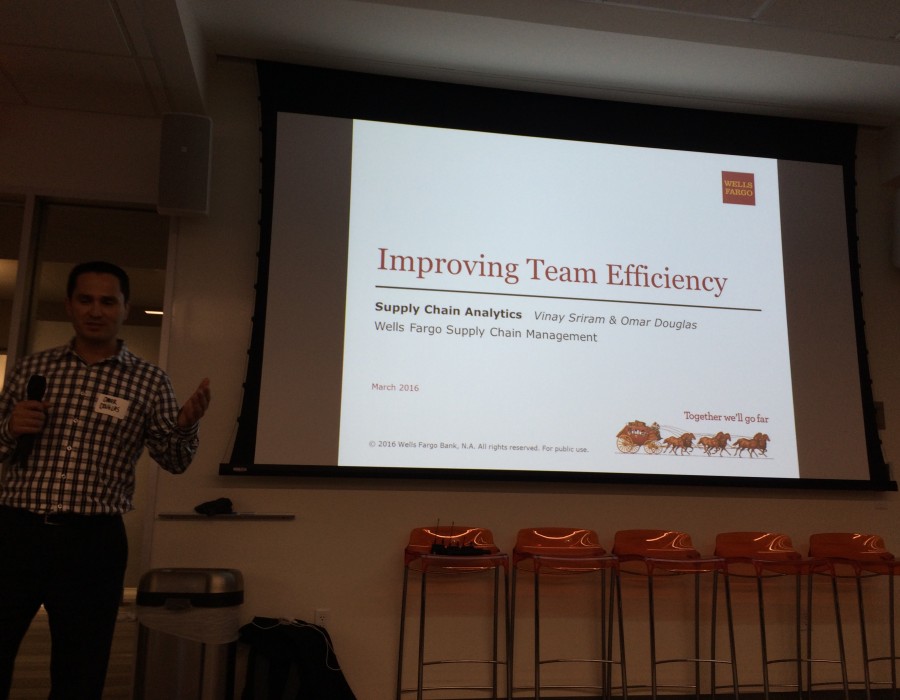
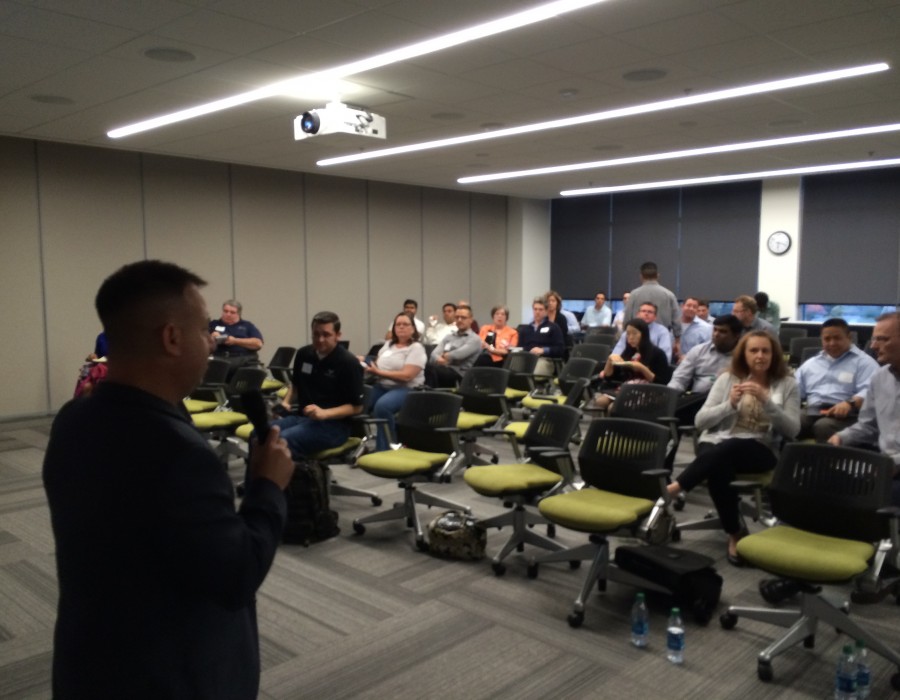
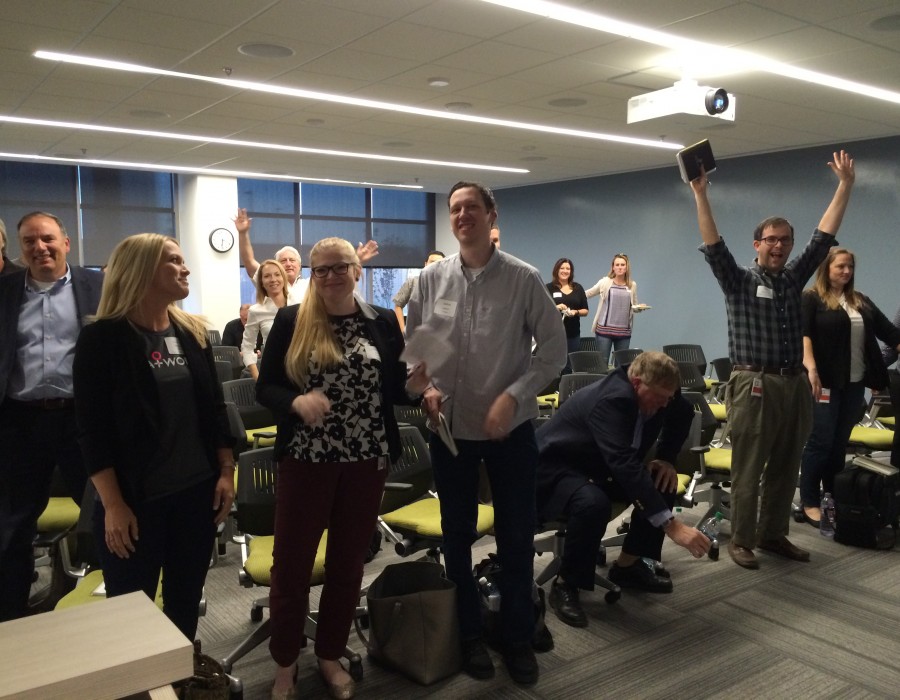
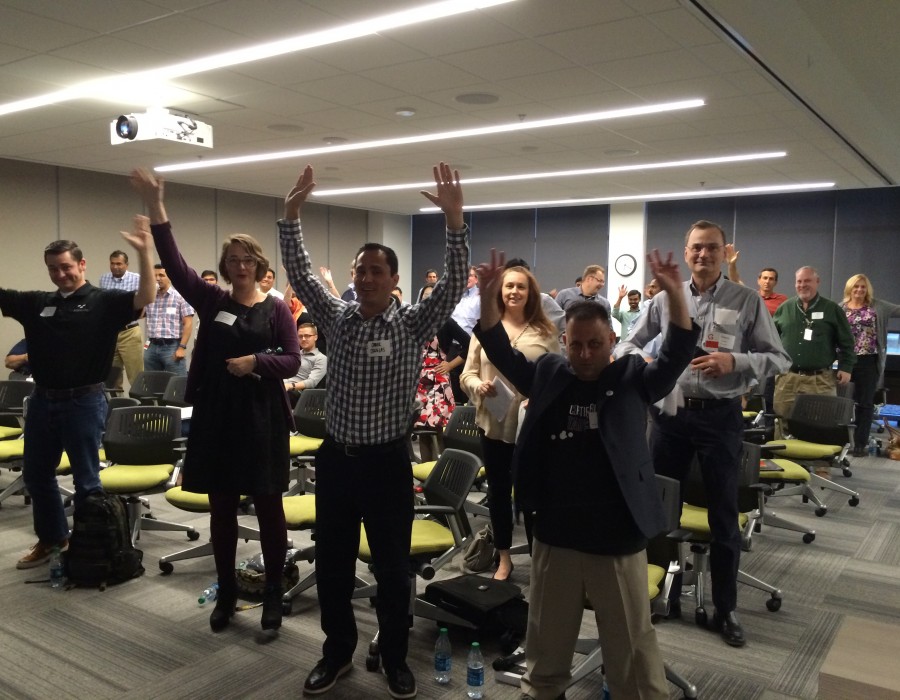
This week was fun. I did a private talk for a large client in Portland, Oregon, then went to Phoenix, Arizona, to give a talk at the Phoenix Tableau User Group. The last time I spoke in Phoenix, AAA hosted a great but small event that around 15 people attended. This week, Wells Fargo hosted a much larger number (I would guess 80 to 90 people). Before my talk, Vinay Sriram and Omar Douglas from Wells Fargo’s Supply Chain Management Team discussed their new Tableau deployment. After that, another Well’s Fargo manager (whose name I didn’t write down) spoke about how his team was using Tableau to analyze credit operations.
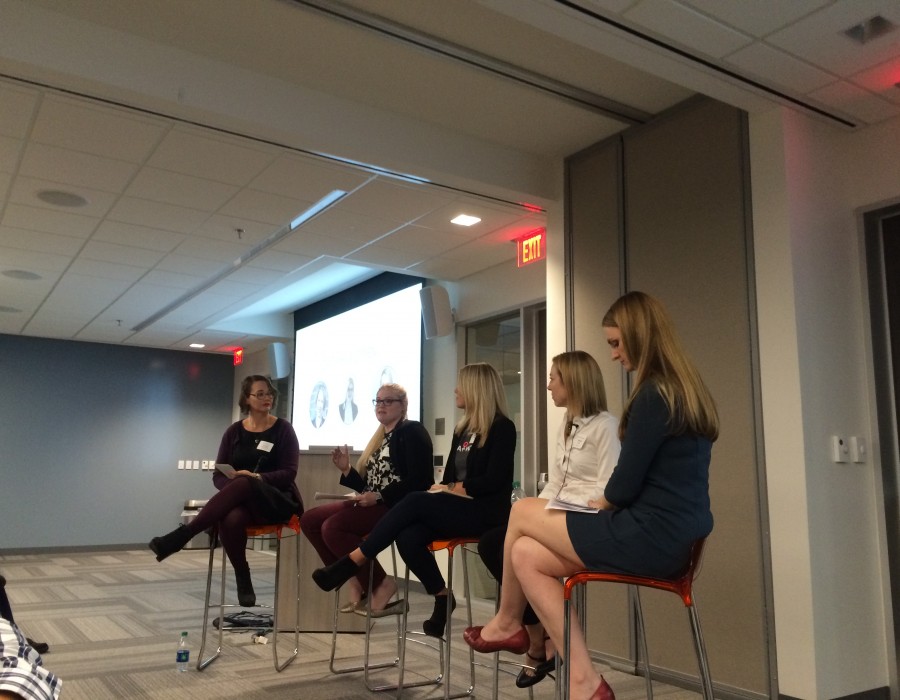
After my talk finished, there was a special Q&A session entitled Data+Women that included statistician/consultant Melissa Kovacs (a fellow Purdue/Krannert Grad), Ann Jackson, Aetna and Stephanie McCrea of Wells Fargo. Jessica-Briggs-Sullivan of AAA (who also has one of the largest and coolest dashboard control center’s I’ve seen anywhere) was asking questions along with Angie Greenlaw of Wells Fargo.
It’s exciting to participate with a TUG that has excited members who are willing to share their success stories!
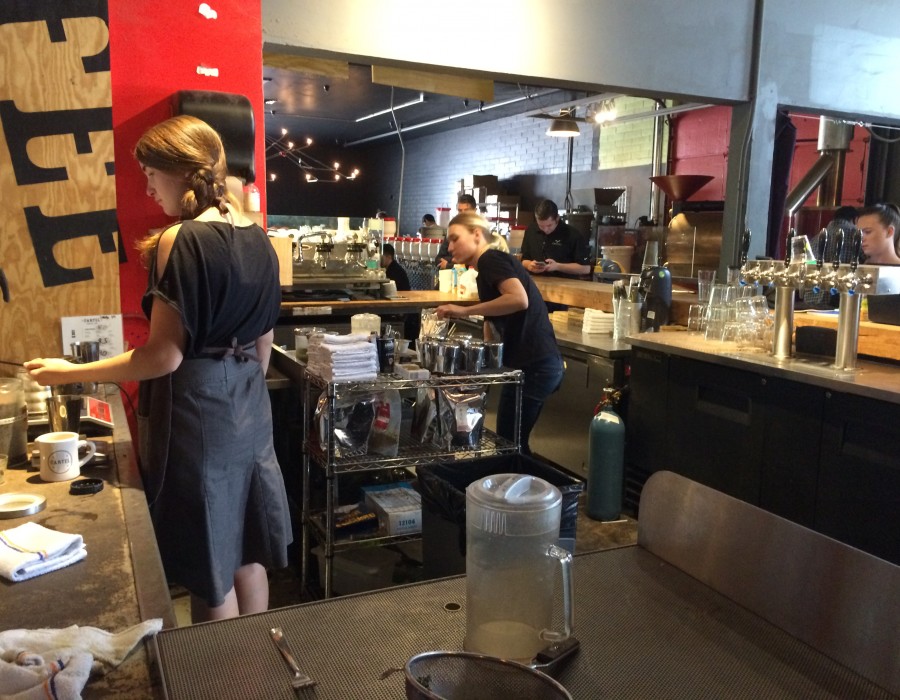
The sample files below include sections of the talk that I skipped due to time constraints. I enjoyed the conversion during the event and the reception afterwards with the TUG leadership and the presenters. This TUG has made a lot of progress over the last couple of years. A special thanks to Michael Perillo of Charles Schwab for organizing the evening and plugging my book! And thanks to my Phoenix-based teammate, Ken McBride, for the ride from the airport, lunch and the coffee!
Below are my slide decks from the presentations followed by the relevant files:
- Big Trends in Data 1980 to Now
- Data Interpreter START Workbook
- Data Interpreter FINISHED Workbook
- Forecasting Workbook
- Parameters Workbook
- Dashboard Discovery Workbook
- Superstore for TYD2 XLSX
- NST-EST2015-01 XLSX
Here are a few photos:

