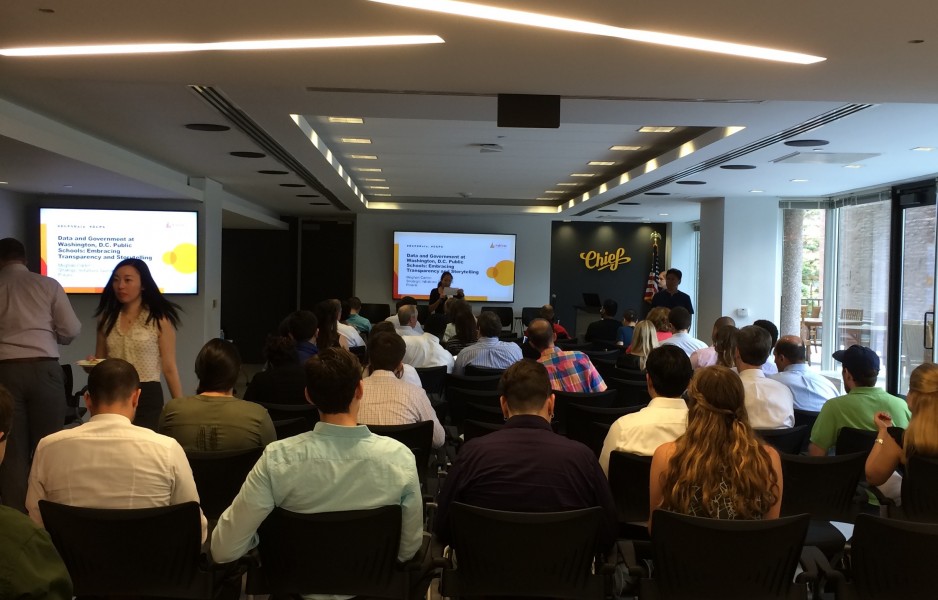
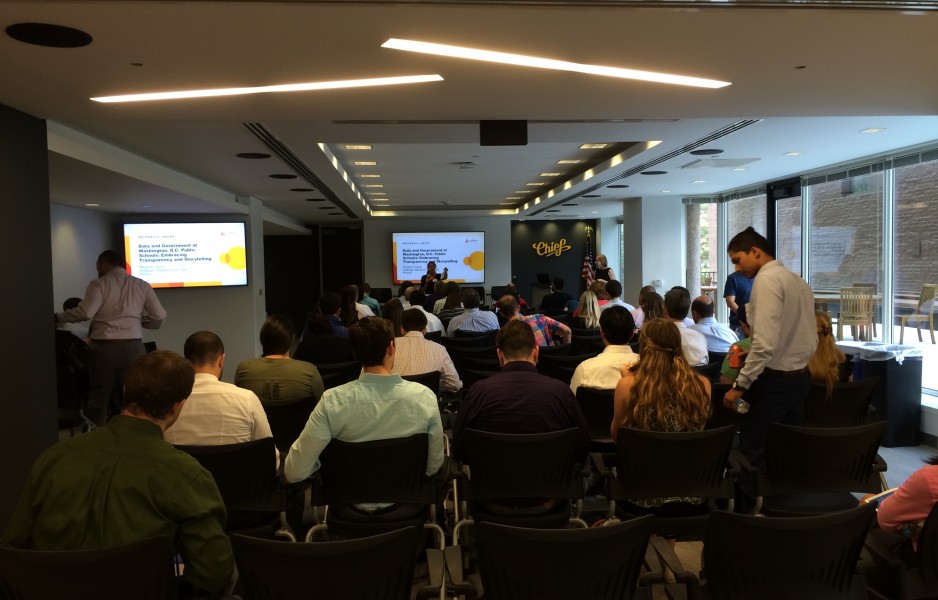
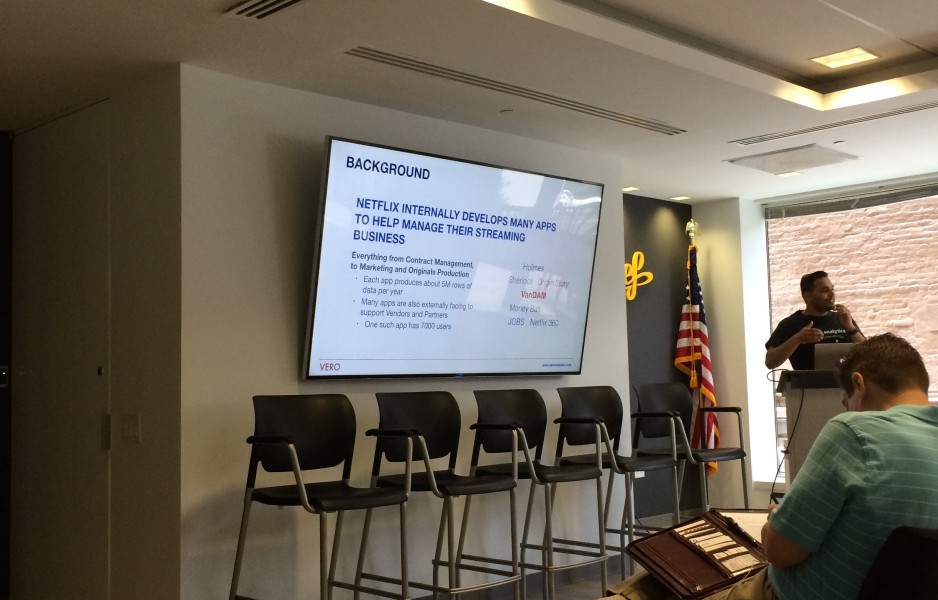
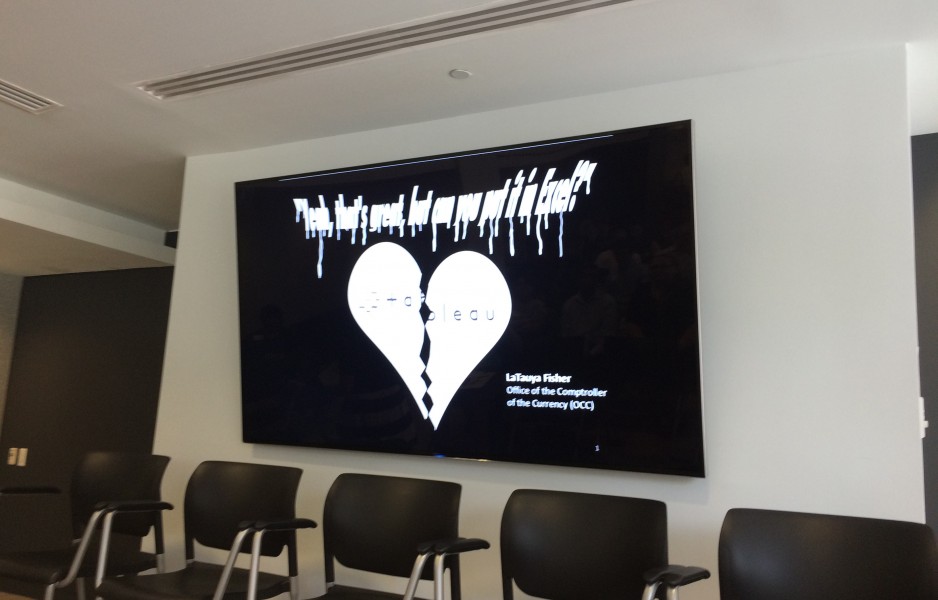
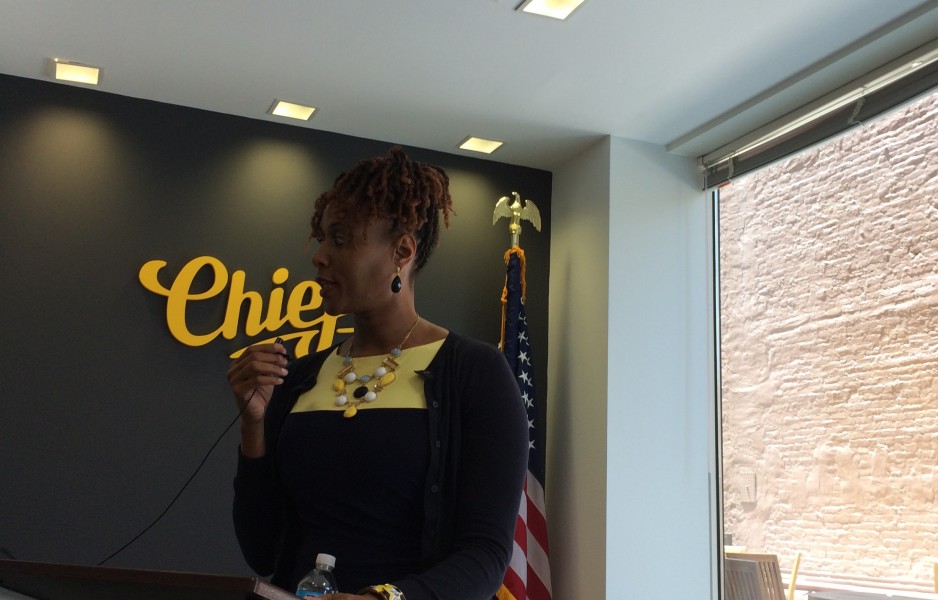
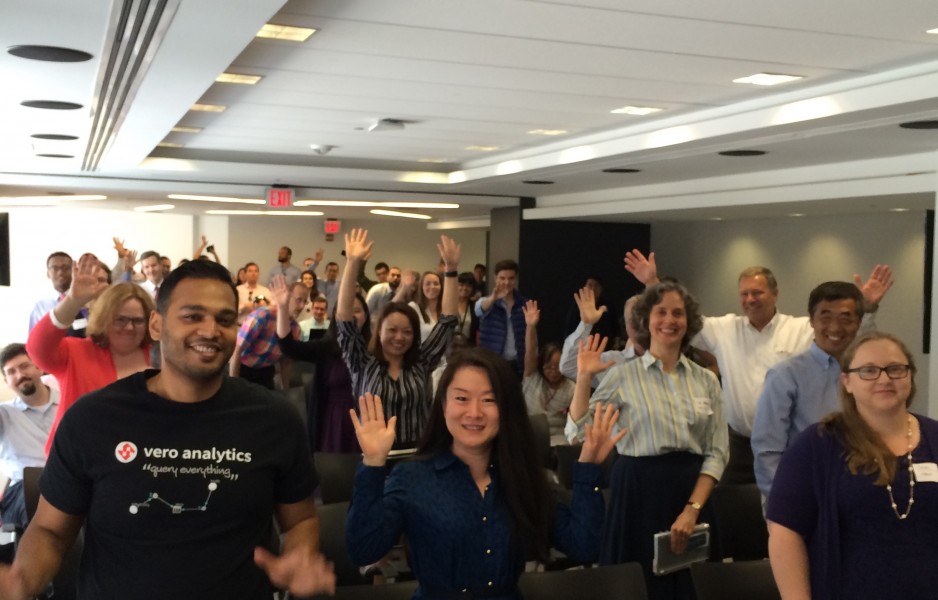
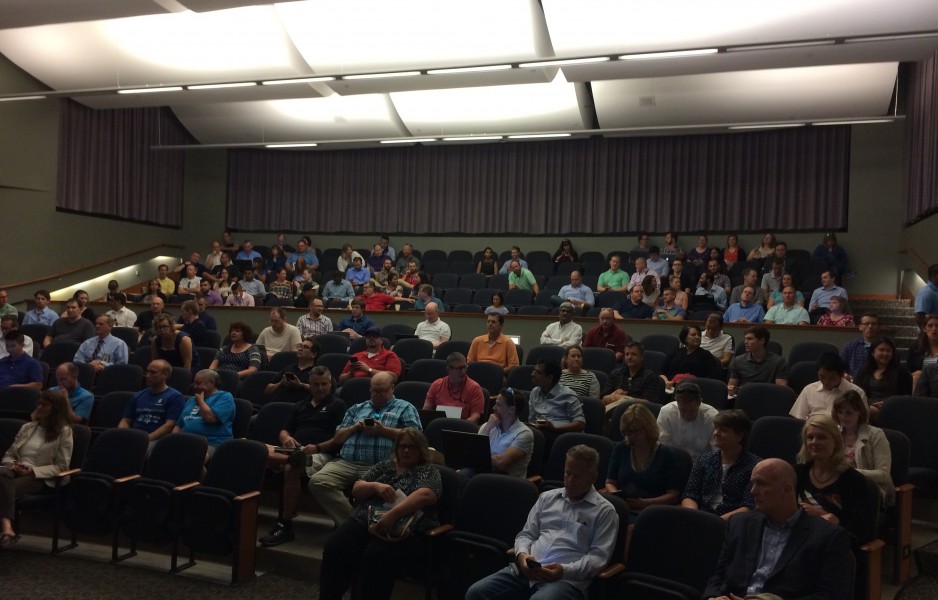
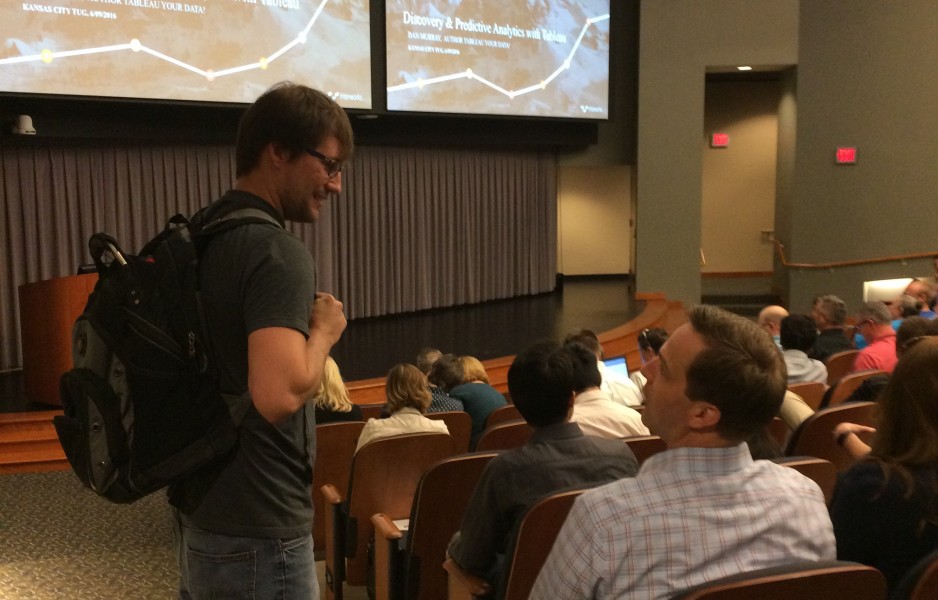
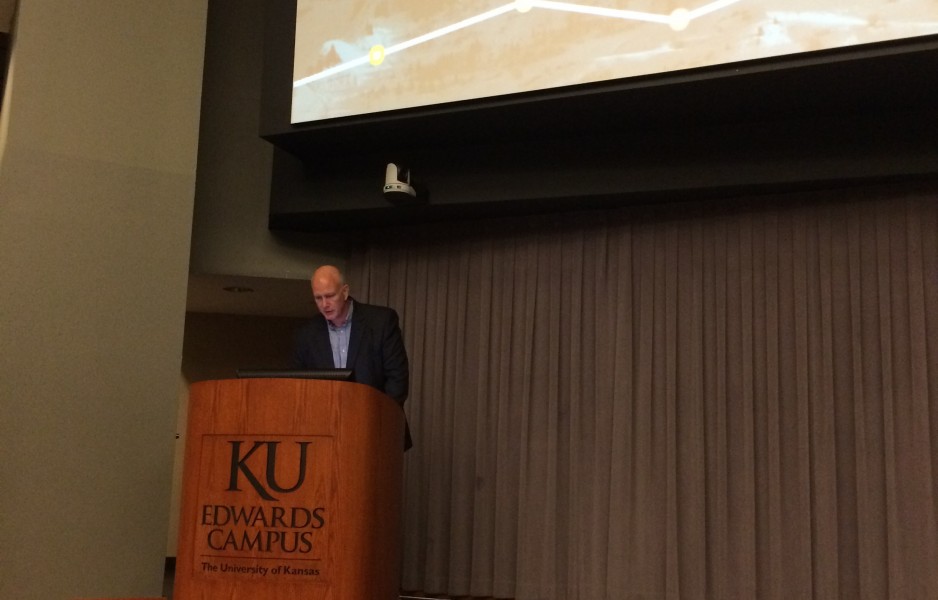
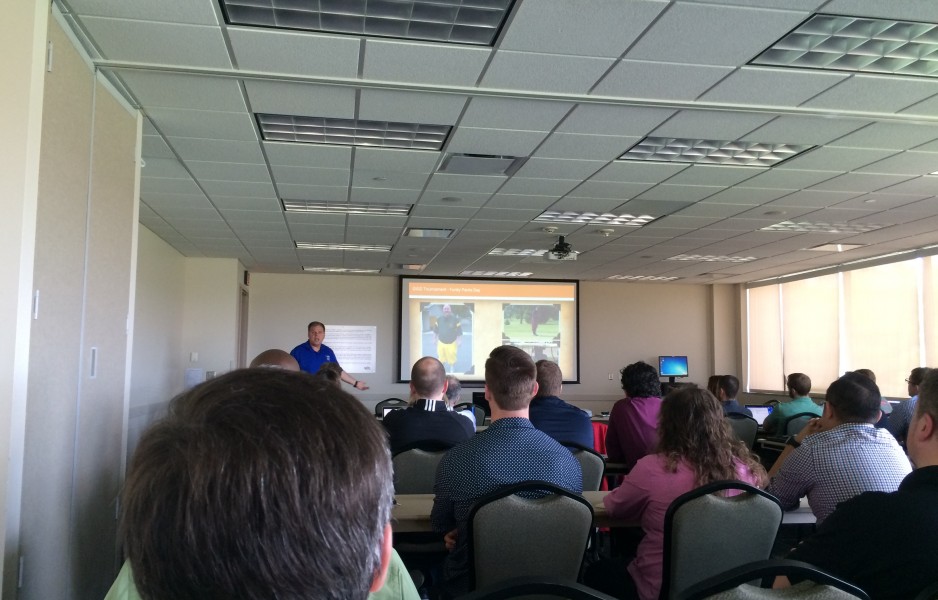
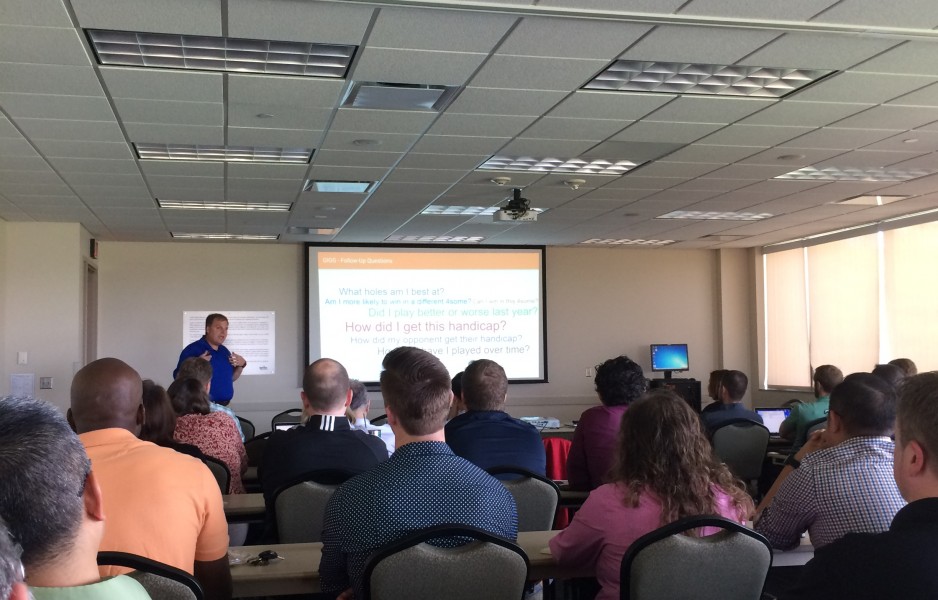
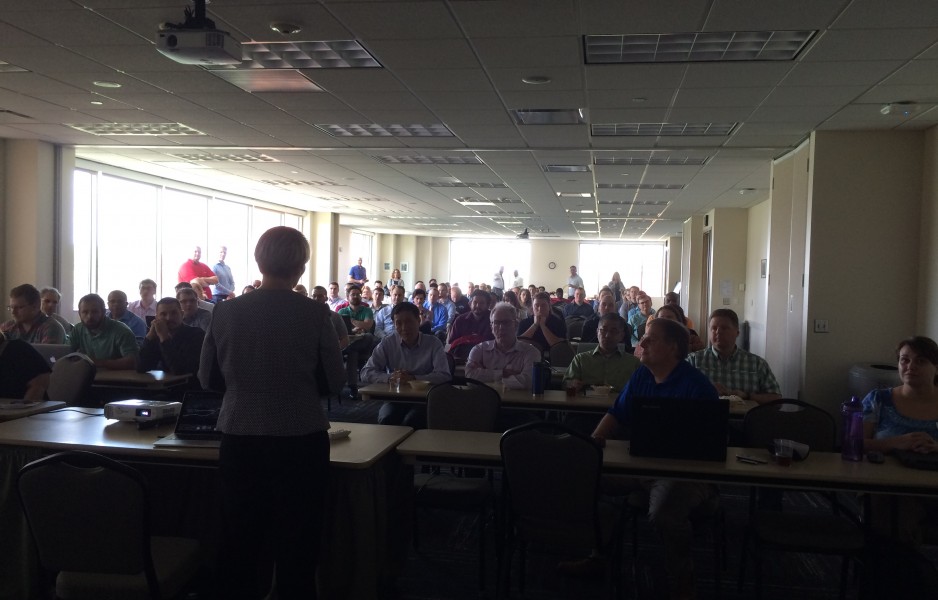
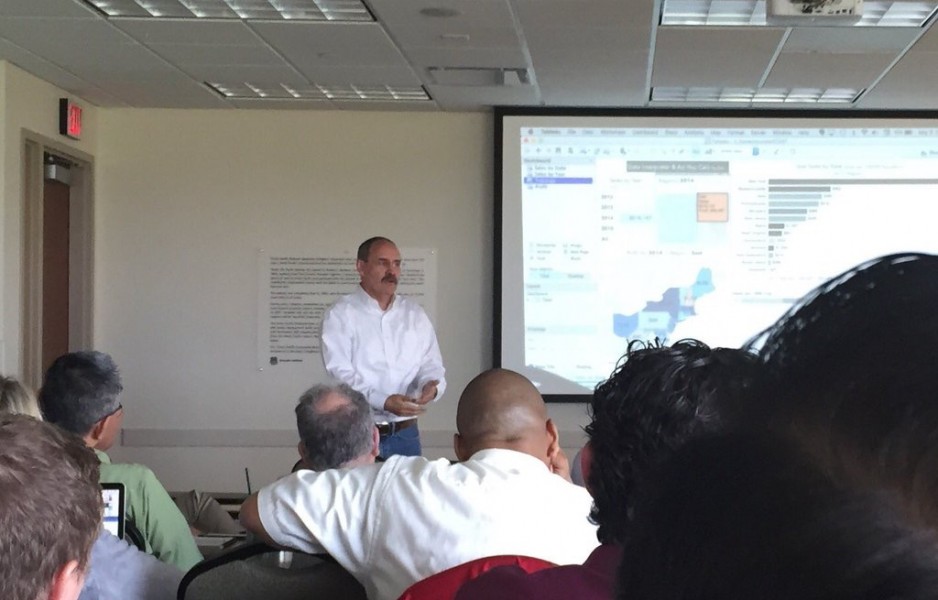
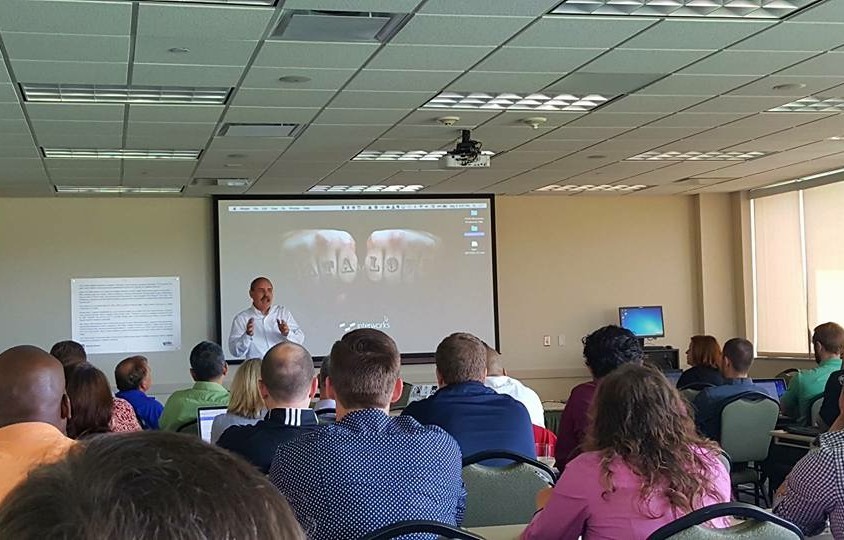
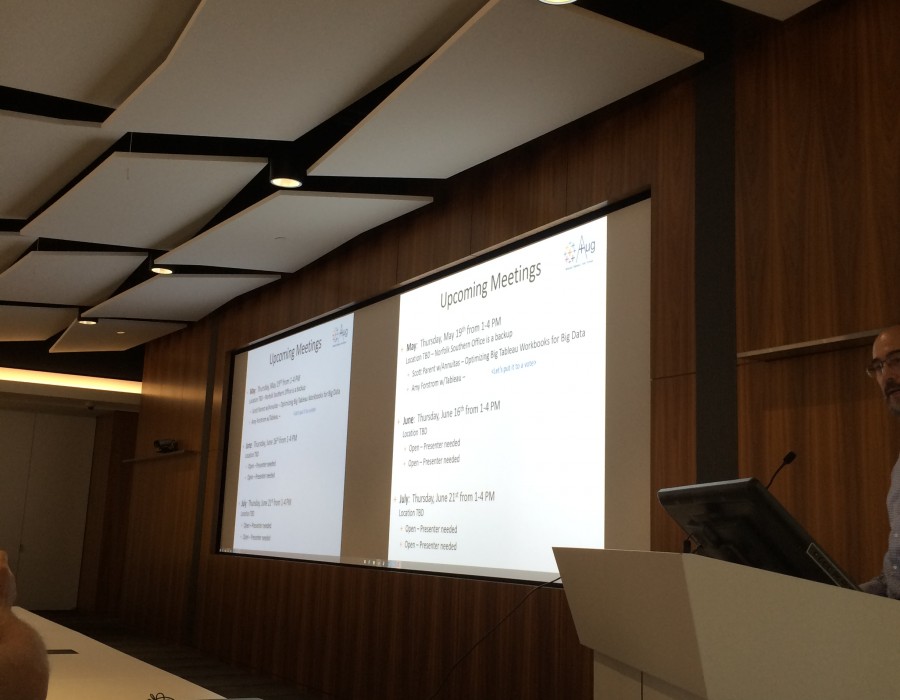
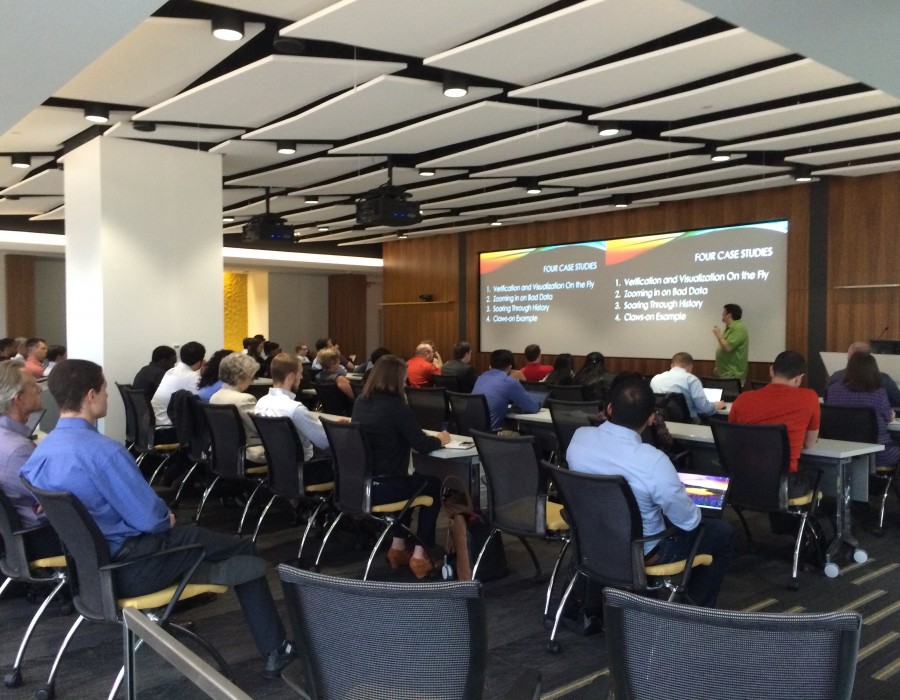
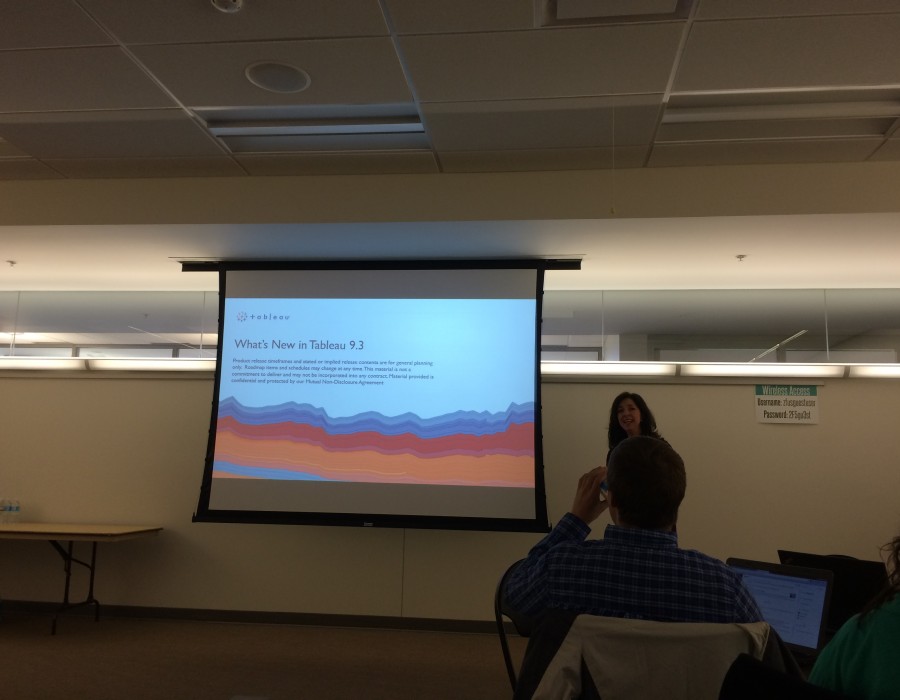
Recently, I went to Washington, D.C. to give a talk for 70–80 people at the Tableau User Group run by Brittany Fong. I was the last presenter of four, which included Meghan Carton of Polaris, Ajo Abraham, founder of Vero, and LaTauya Fisher of the OCC.
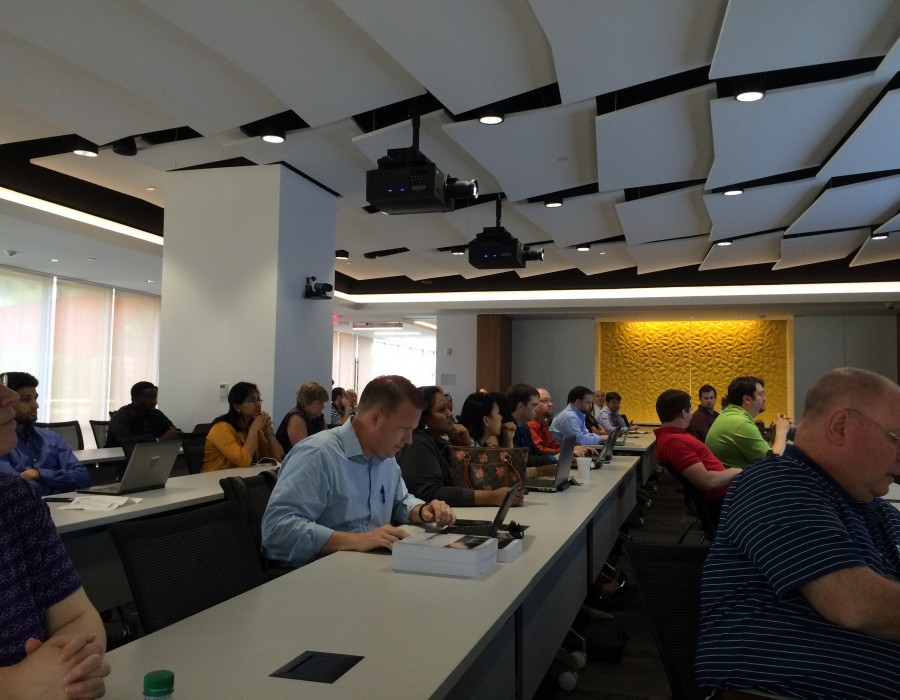
The audience was 80% Federal Agency workers that were all using Tableau. There was a considerable amount of discussion regarding the challenges of getting their user constituencies beyond Excel so they could realize the benefits of visual analytics. InterWorks can help with that!
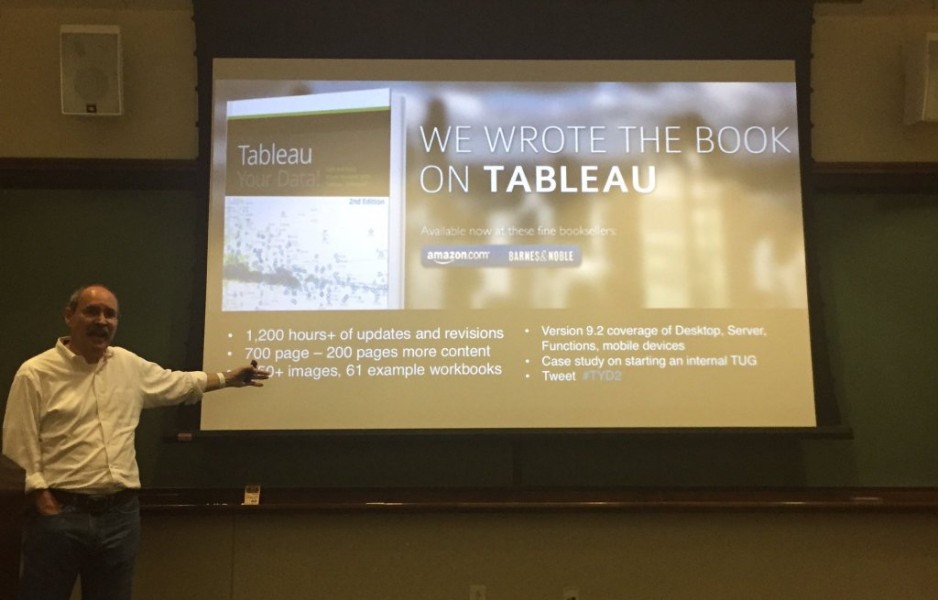
Following my talk, I signed a few books, answered questions for around 45 minutes and then had dinner and great discussion with TUG leader Brittany Fong and Cesar Picco.
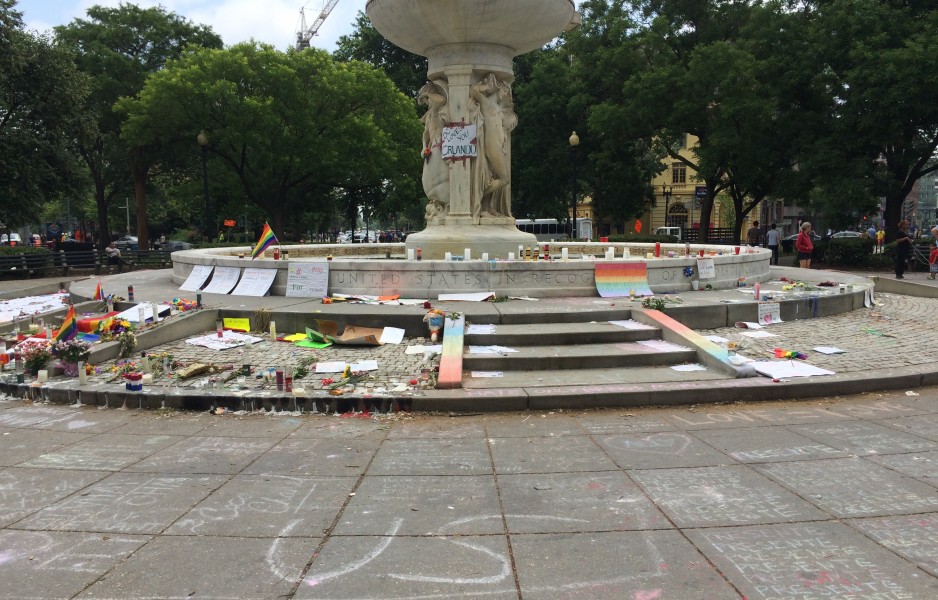
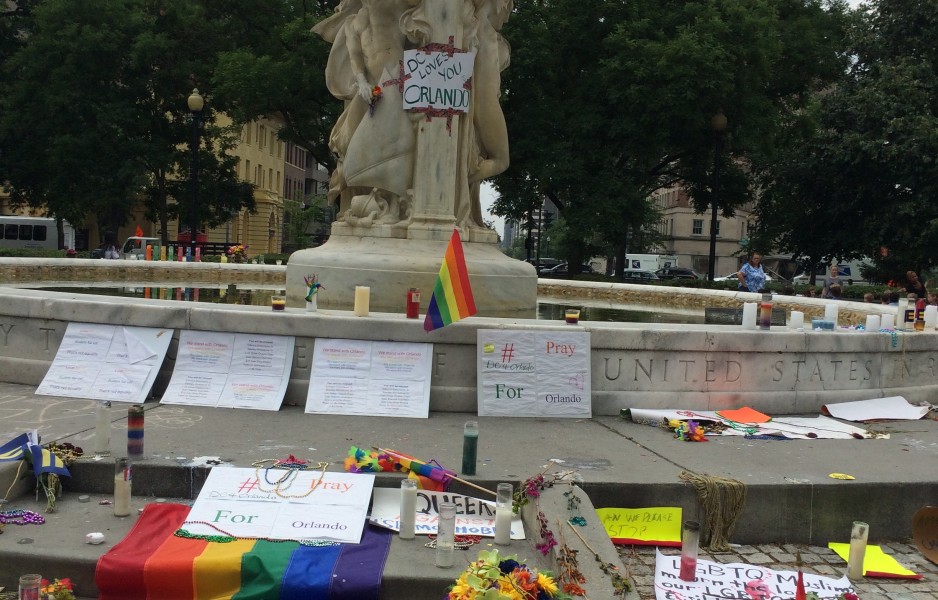
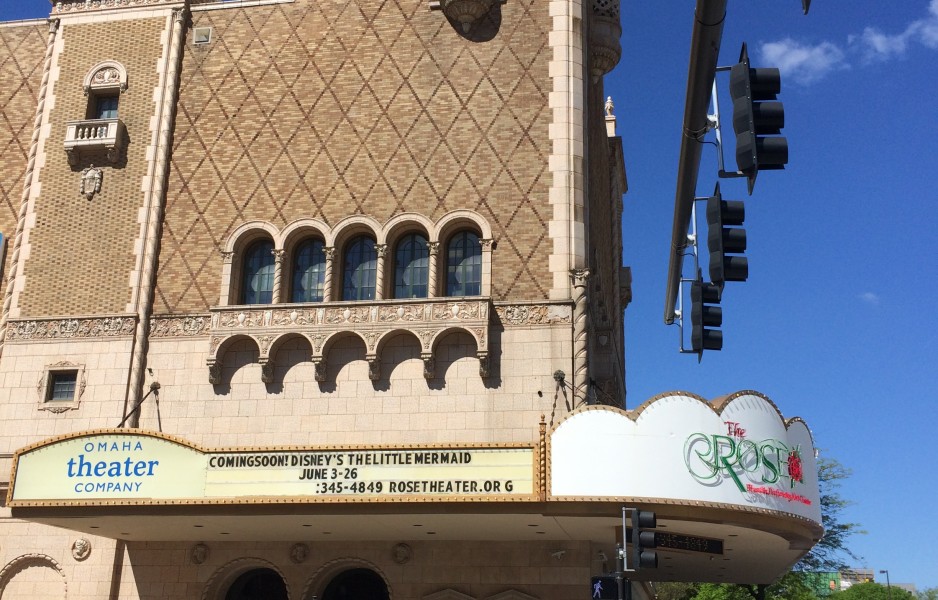
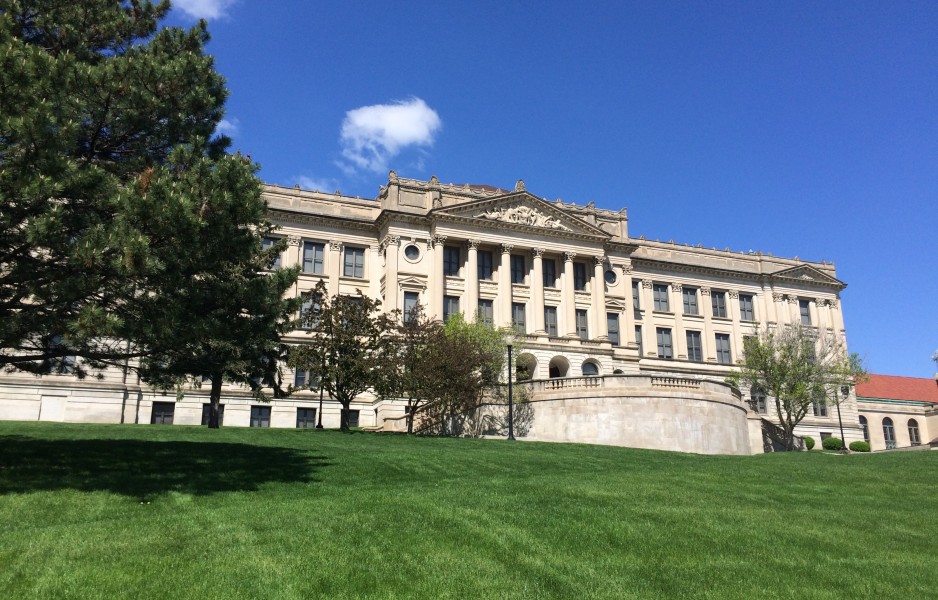
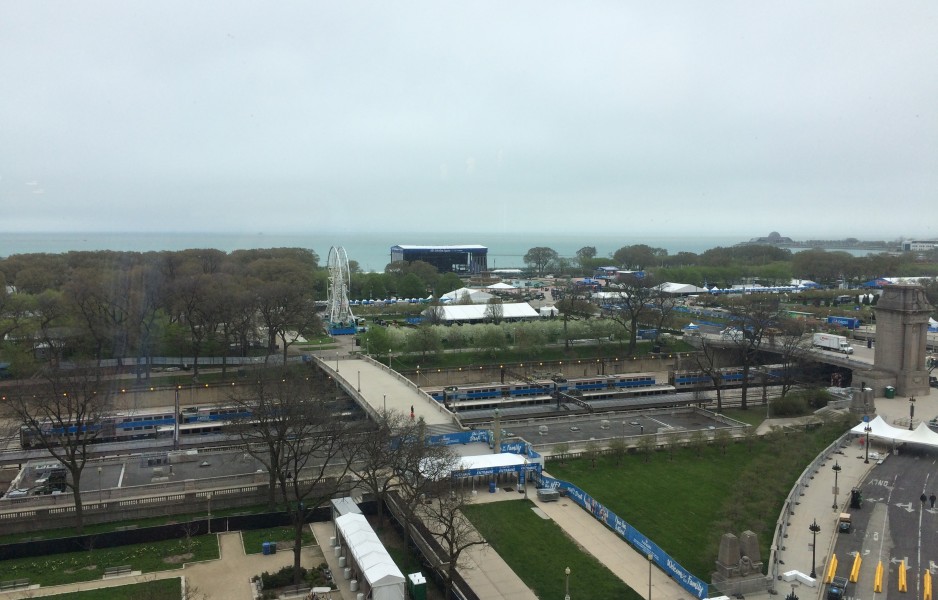
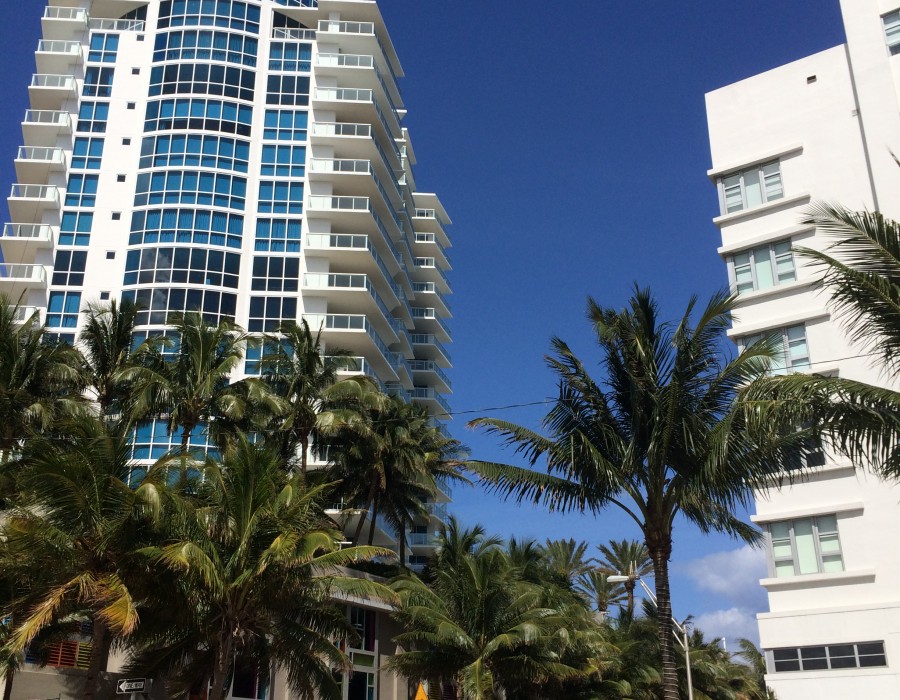
It’s always fun going to our nation’s capital, but there was a somber mood due to the recent violence in Orlando. I’ve included some photos at the bottom of the post of an impromptu memorial for the victims in Dupont Circle.
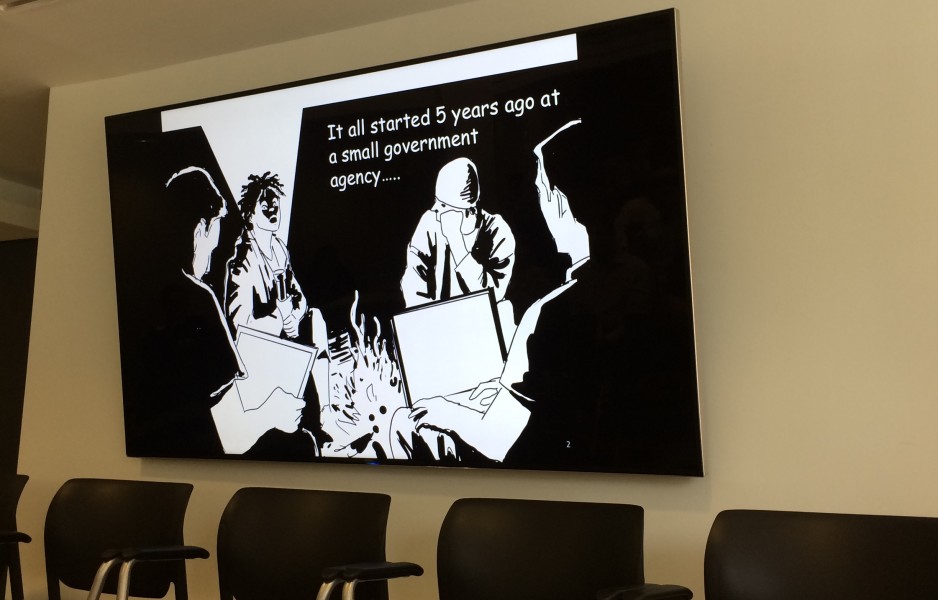
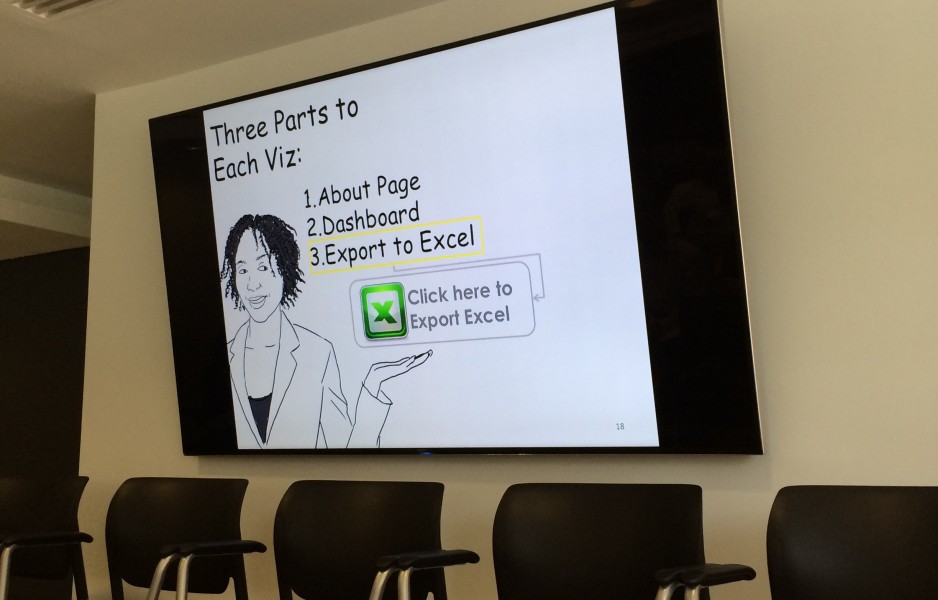
Below is my slide deck from the presentation followed by the relevant files:
- Big Trends in Data 1980 to Now Workbook
- Data Interpreter START Workbook
- Data Interpreter FINISHED Workbook
- Forecasting Workbook
- Dashboard Discovery Workbook
- NST-EST2015-01 XLSX
- Superstore for TYD2 XLSX
- Python R Tableau Demo
- Citibike Data
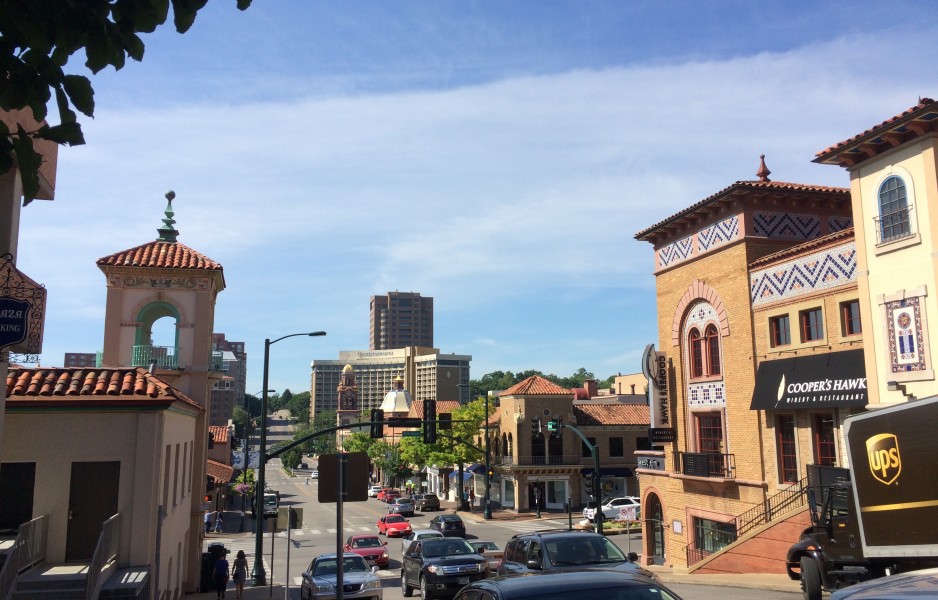
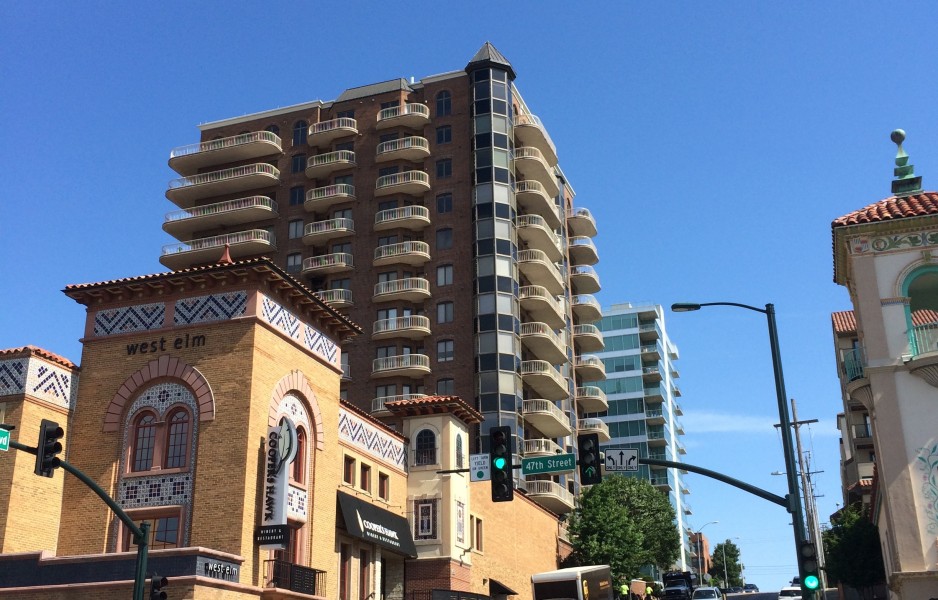
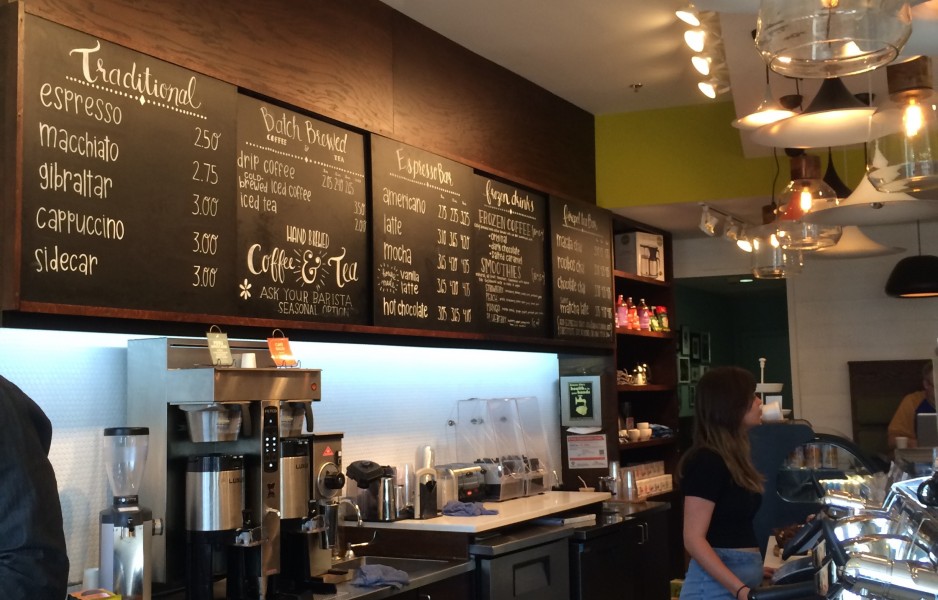
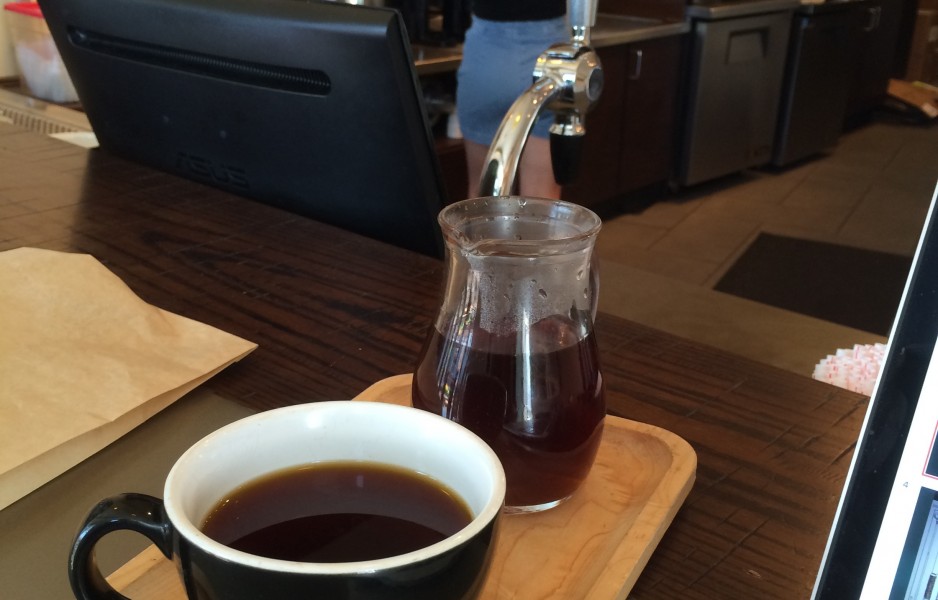
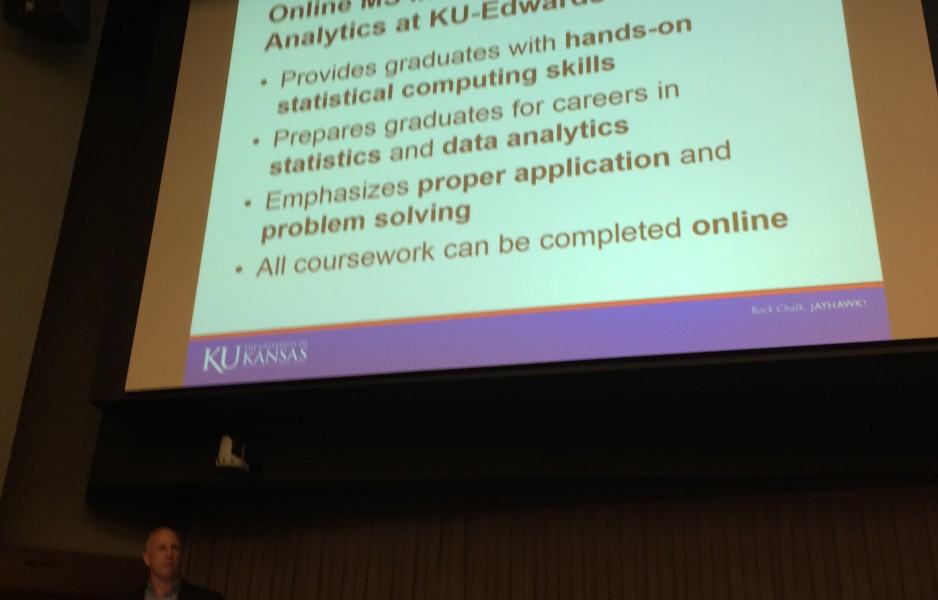
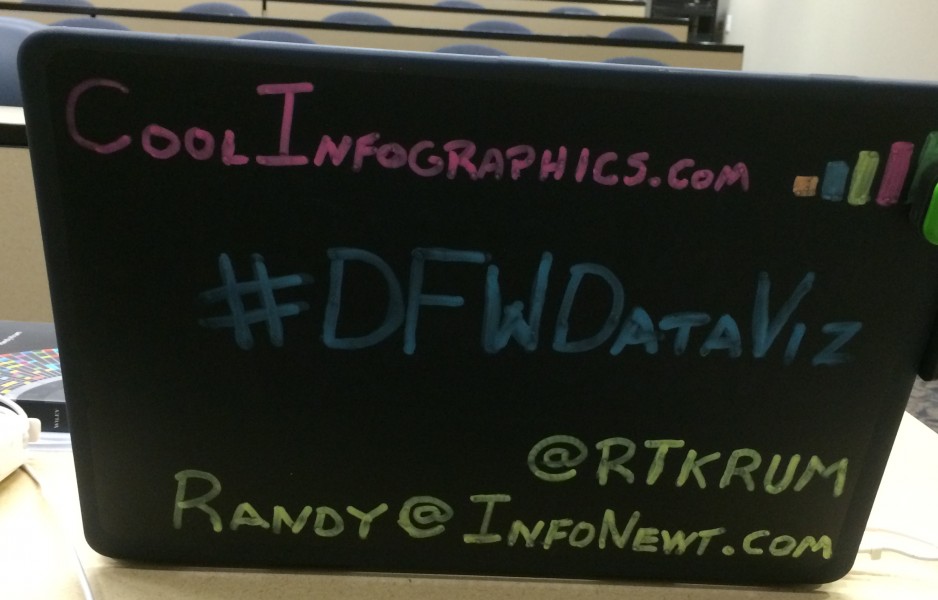
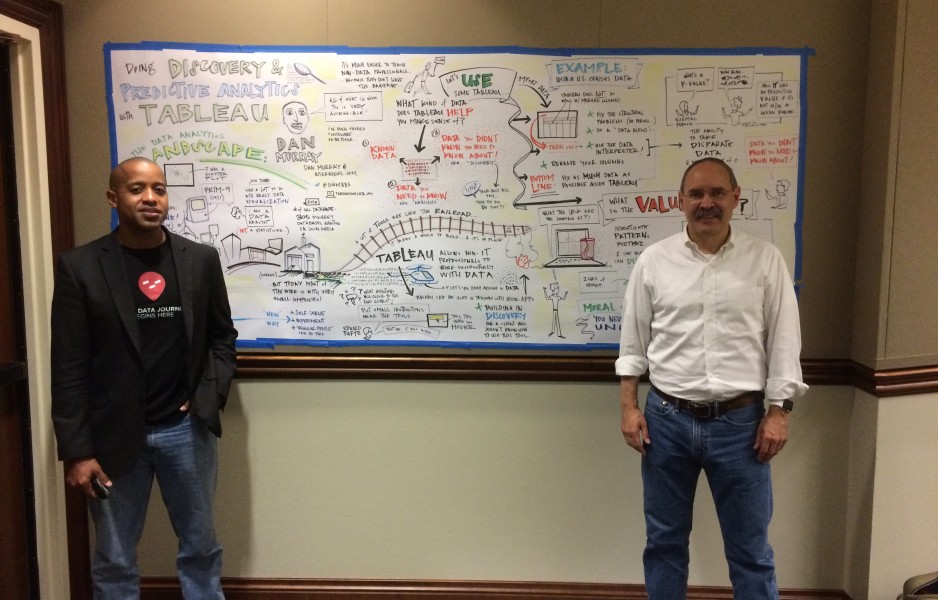
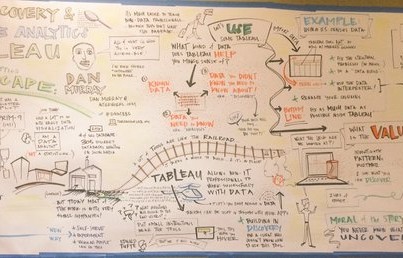
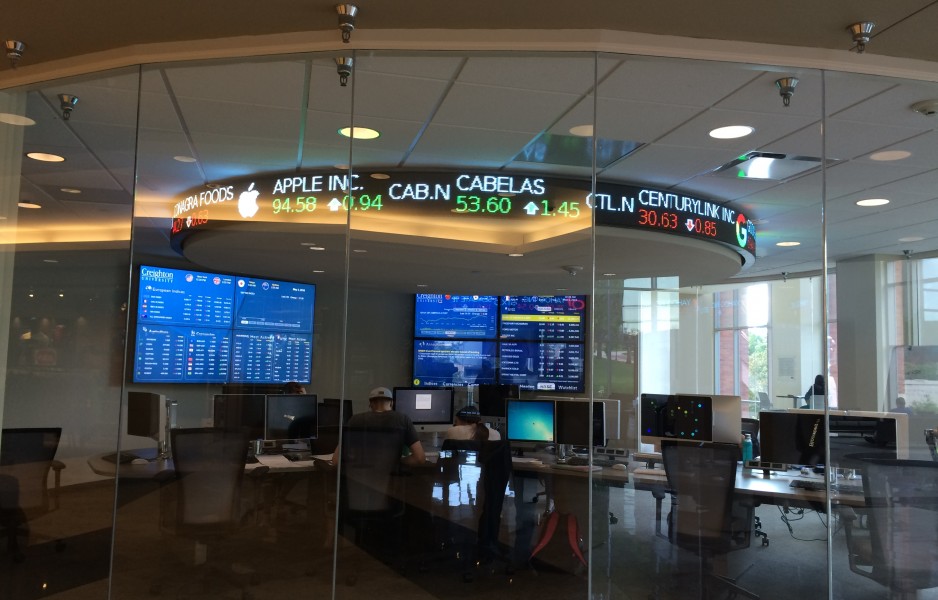
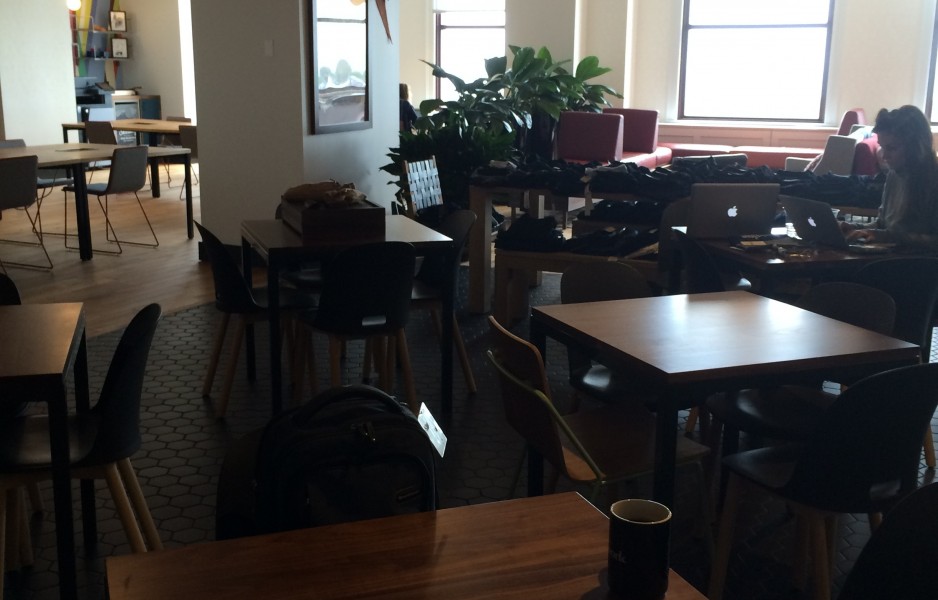
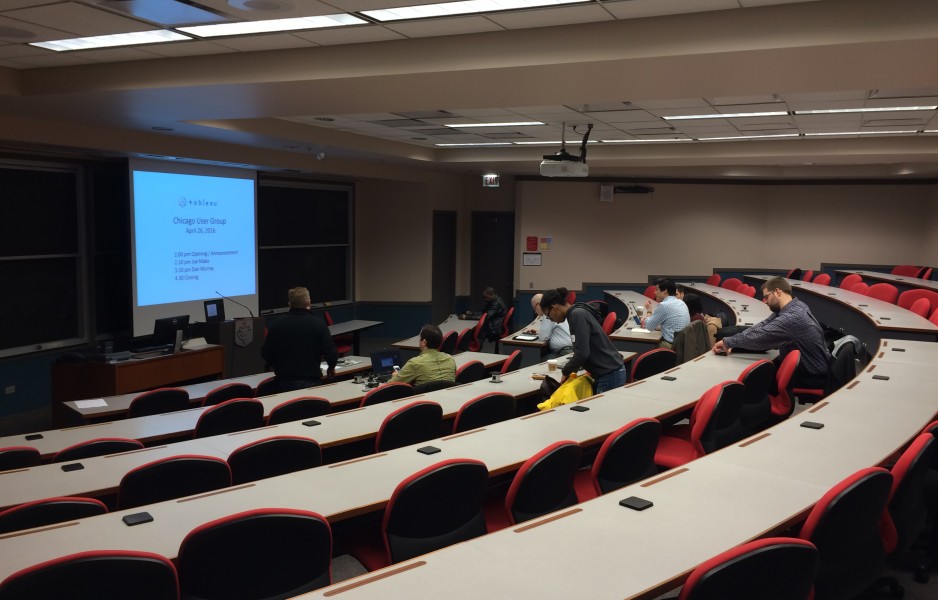
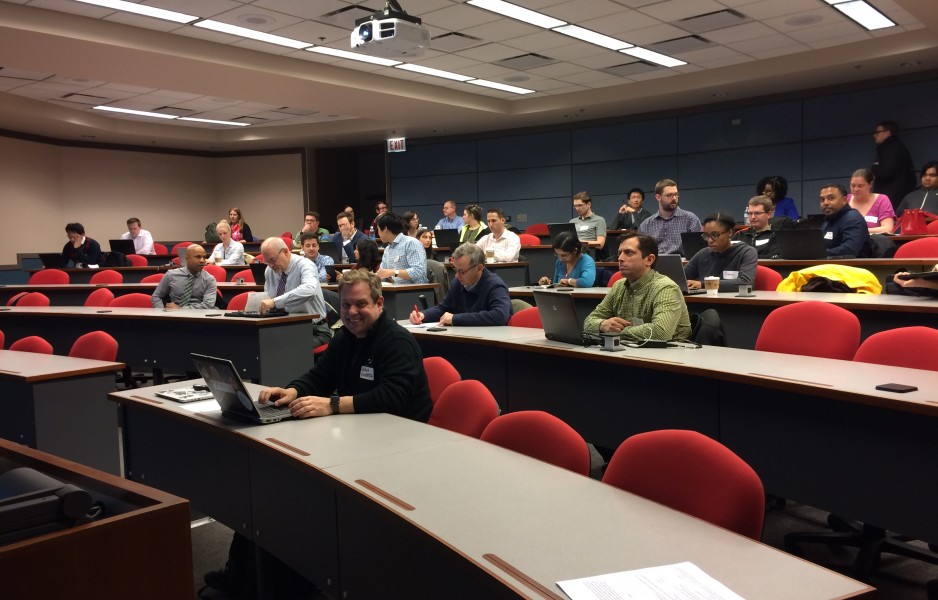
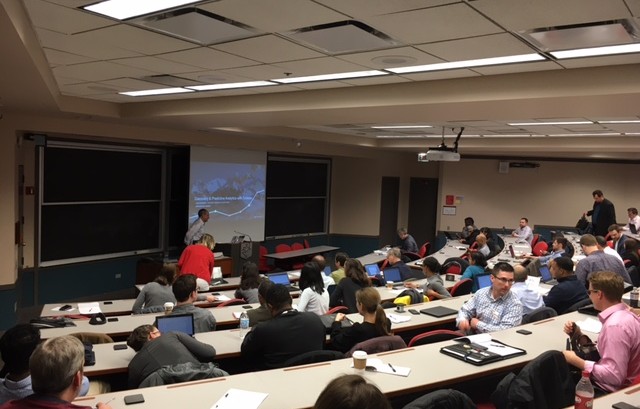
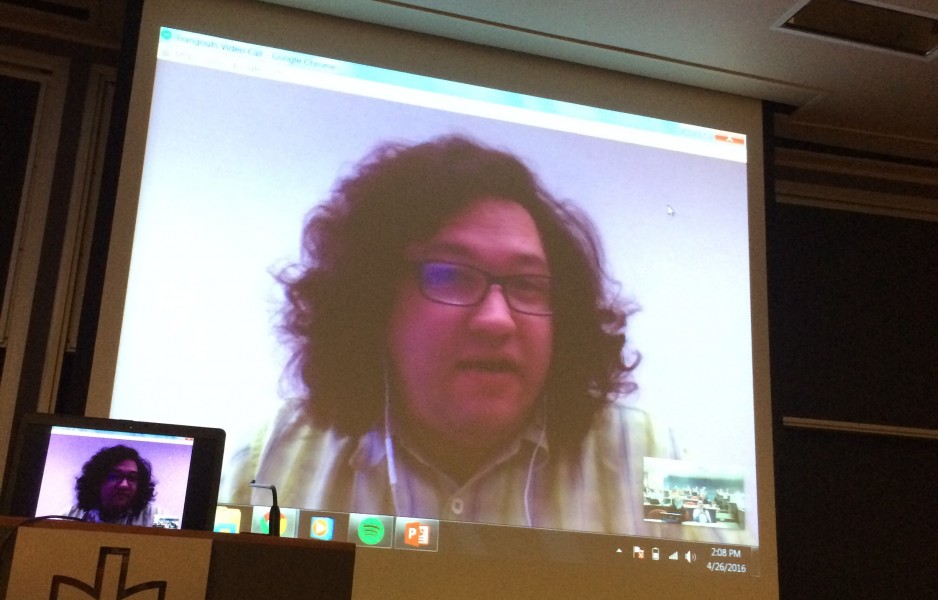
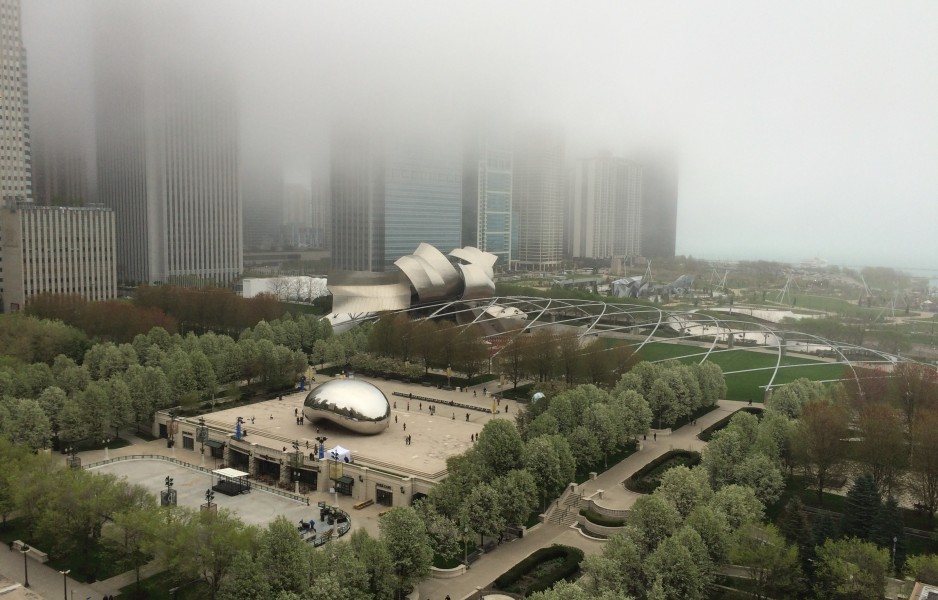
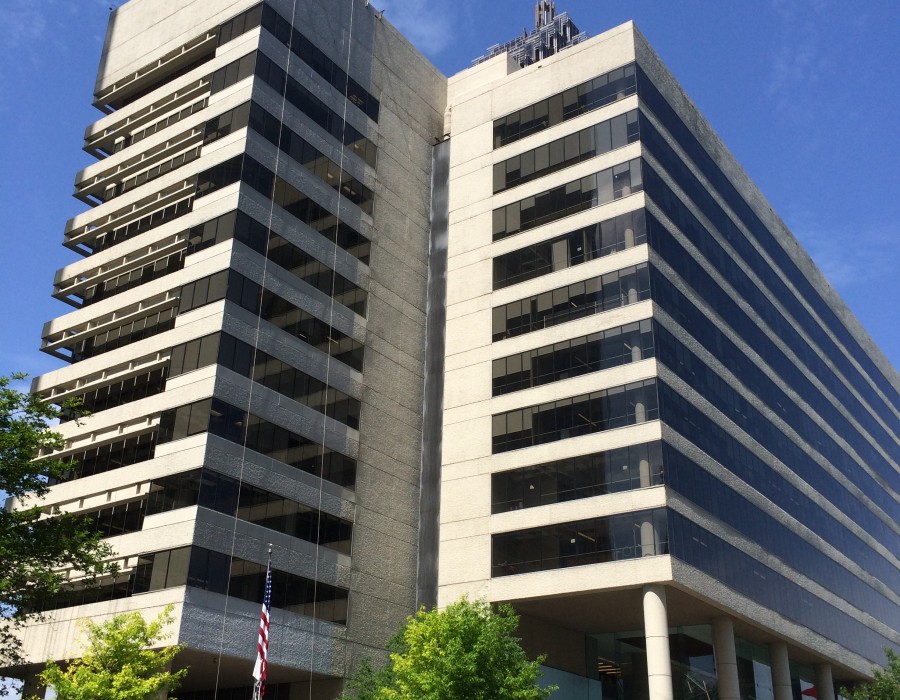
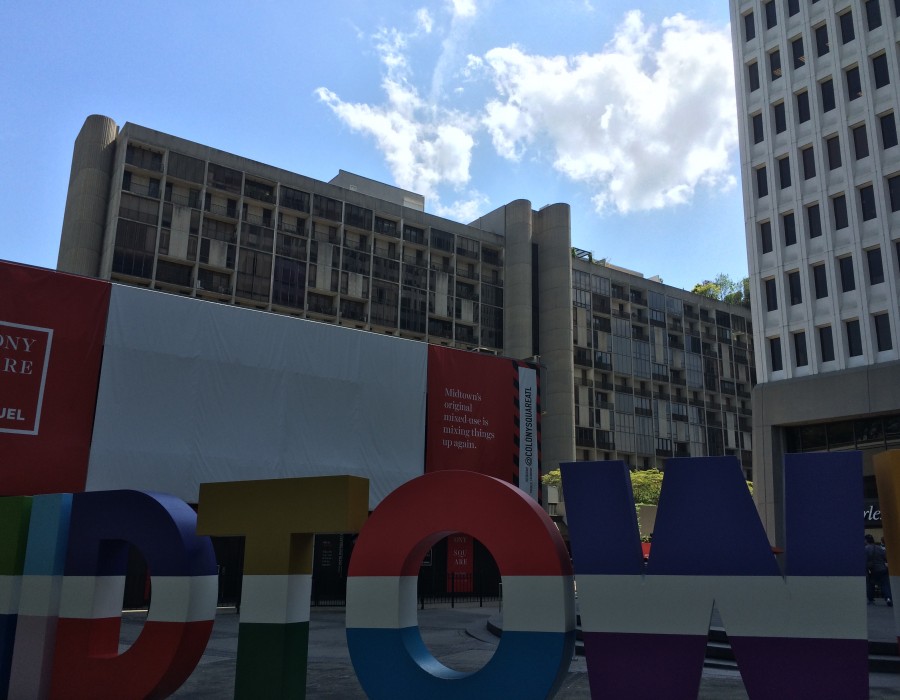
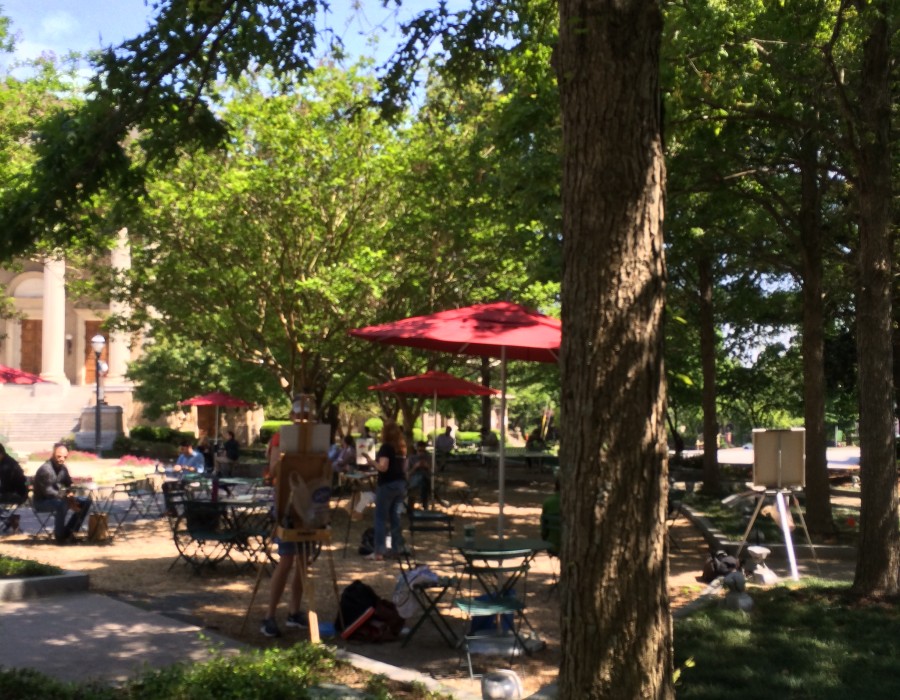
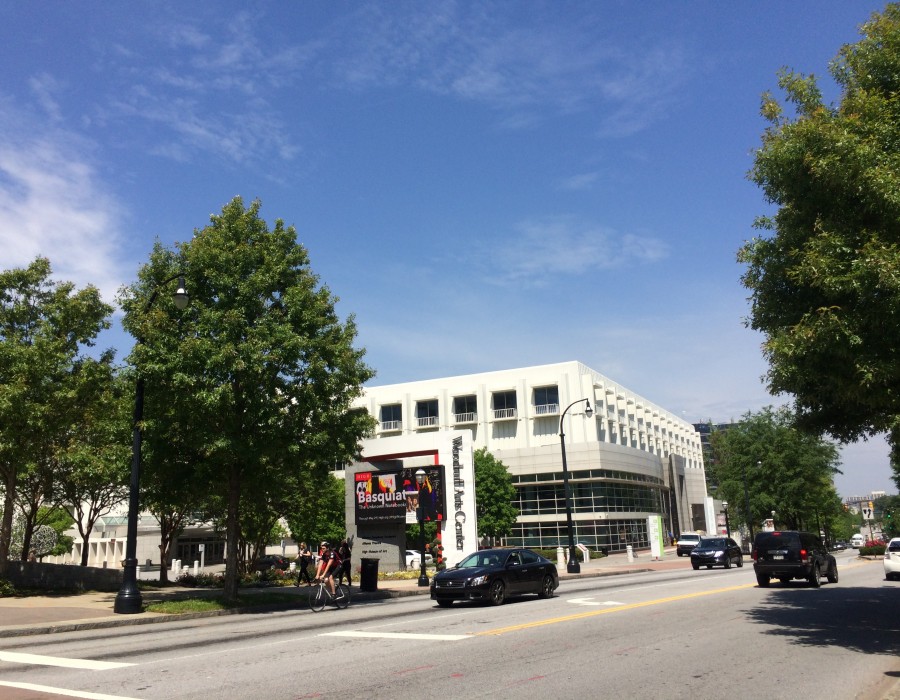
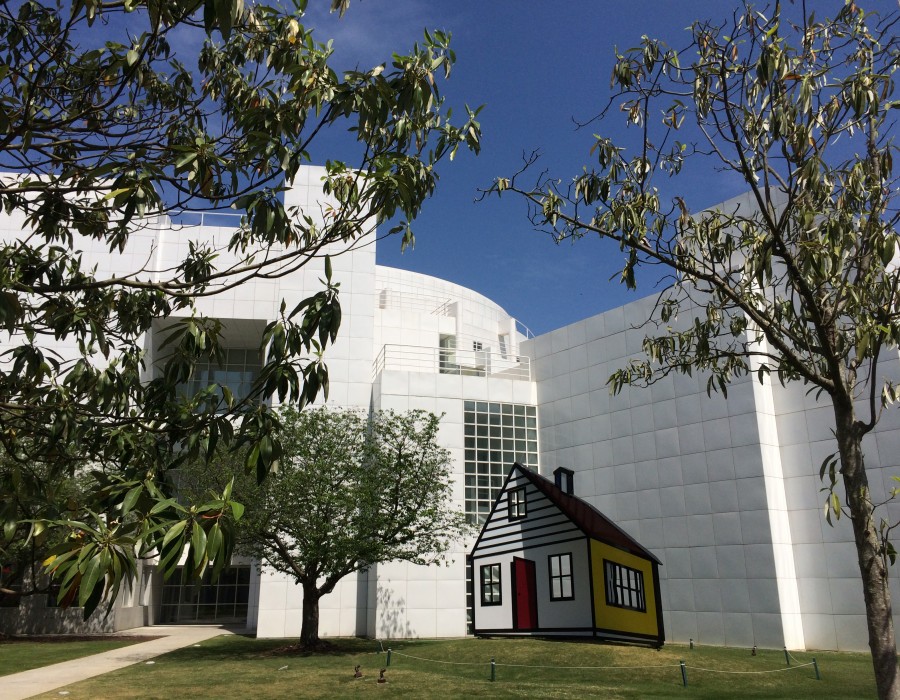
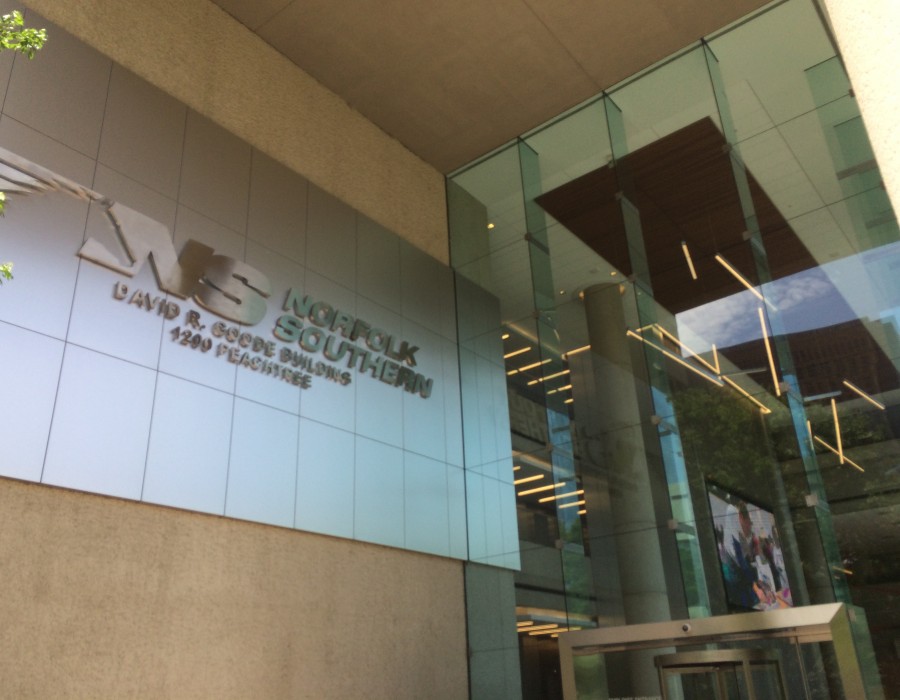
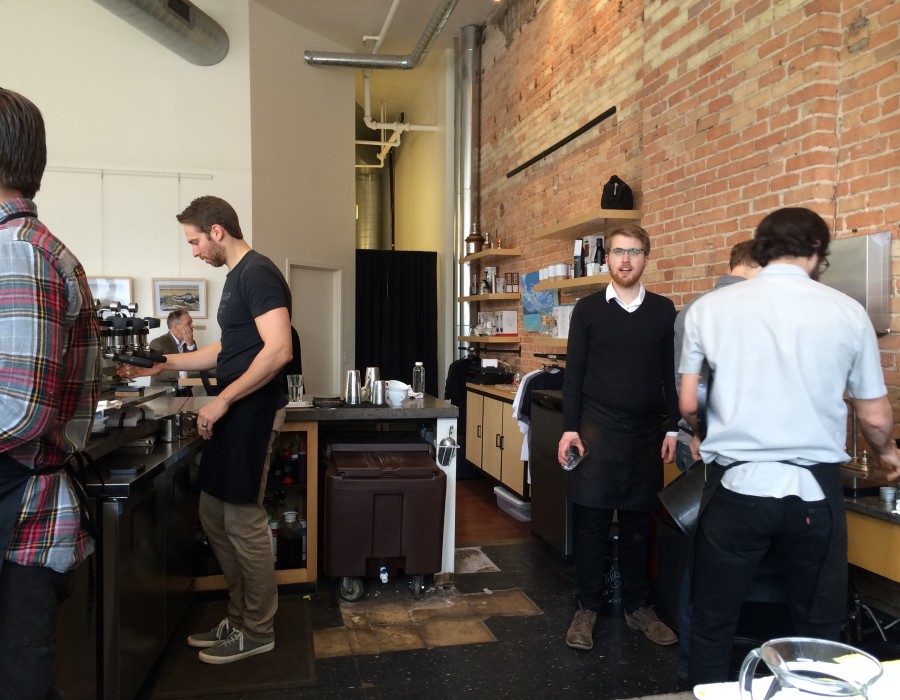
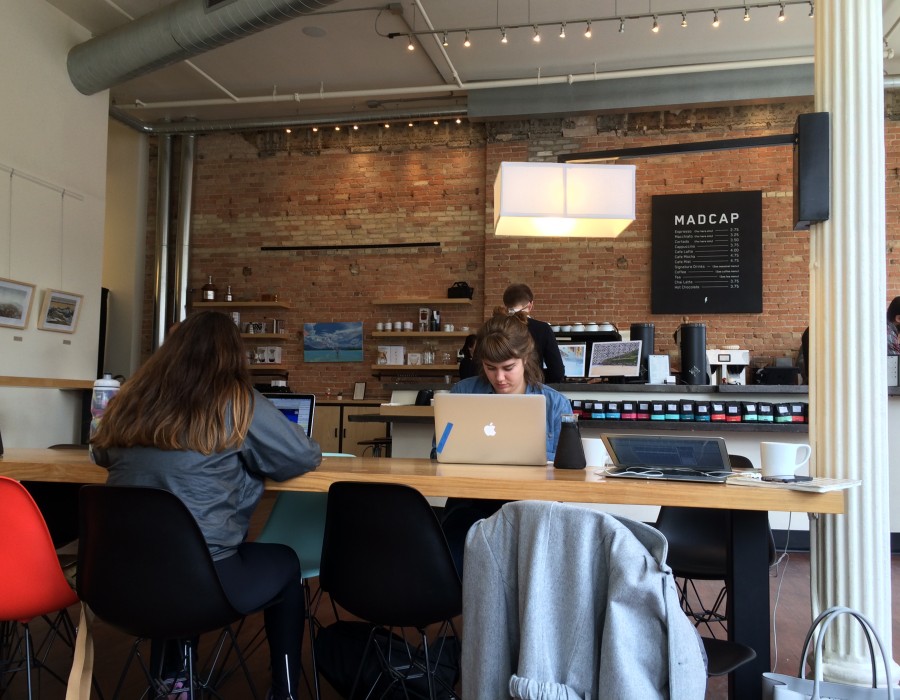
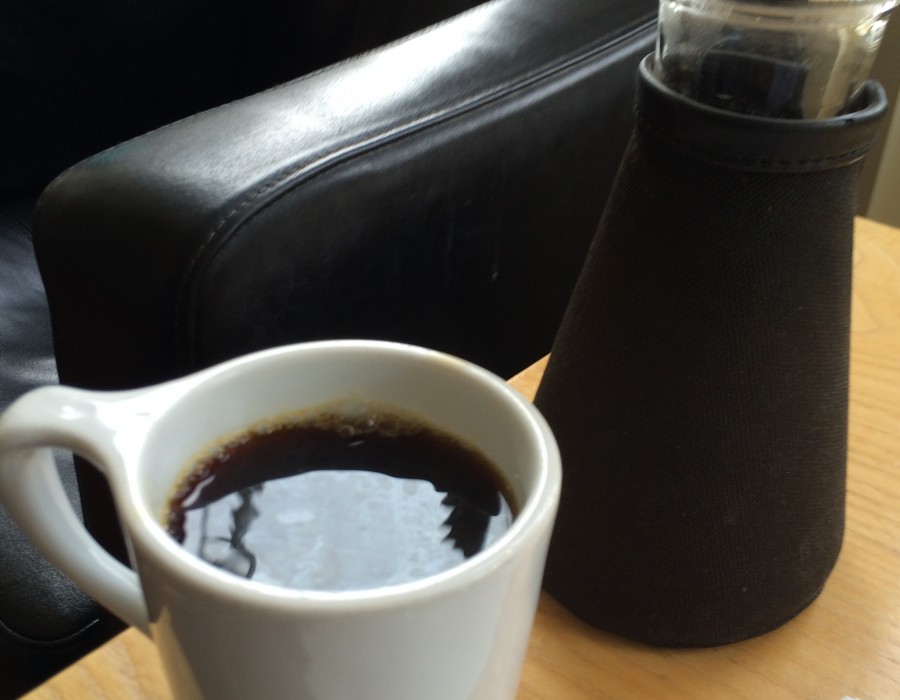
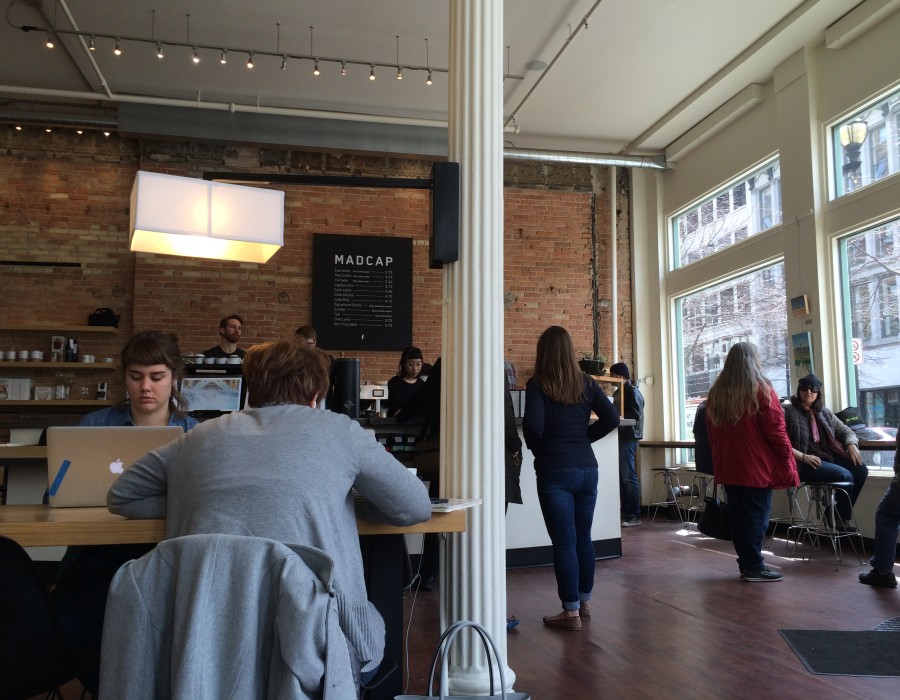
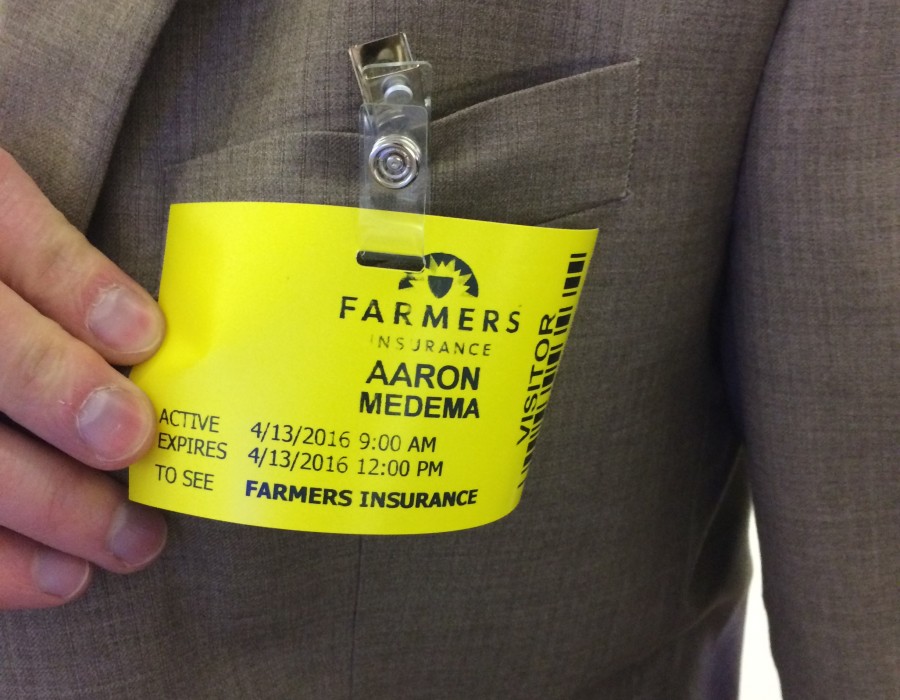
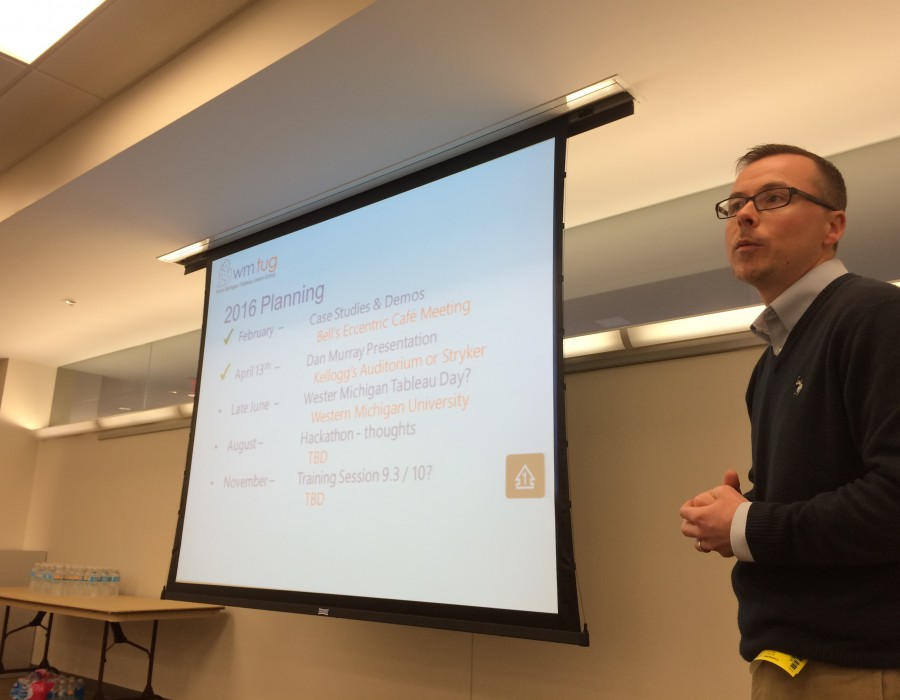
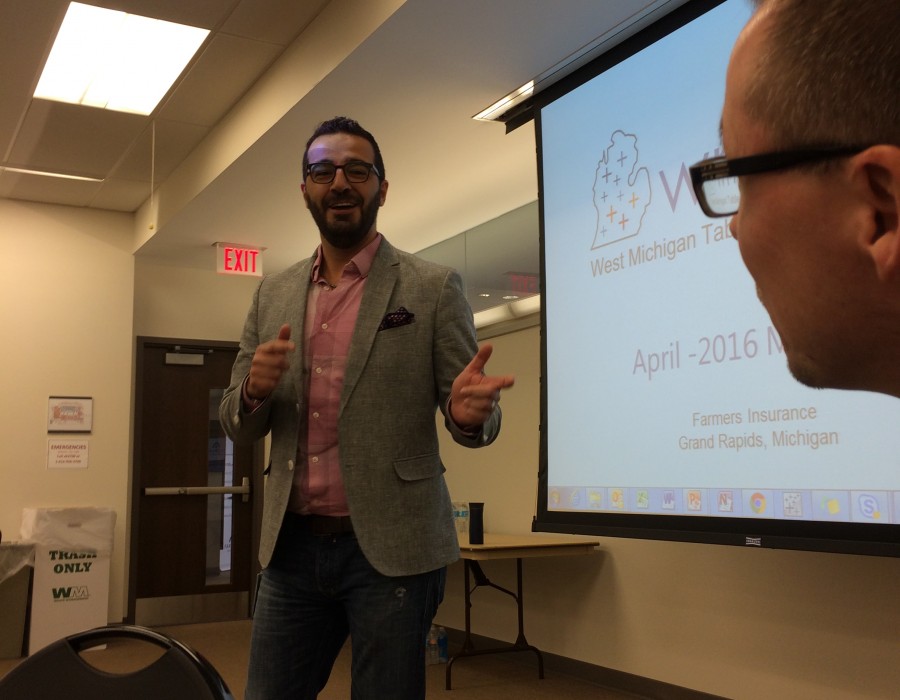
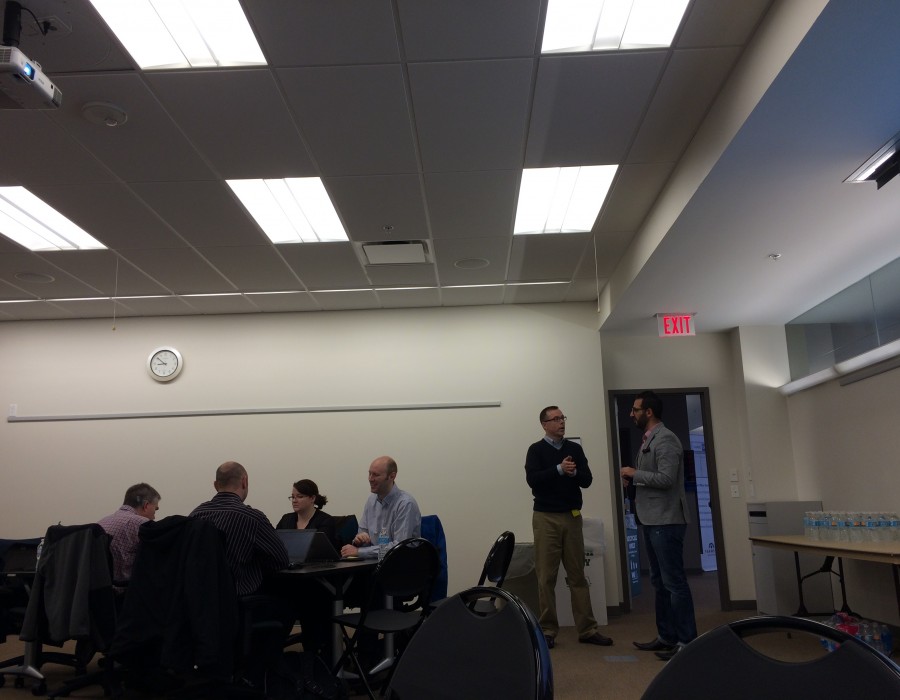
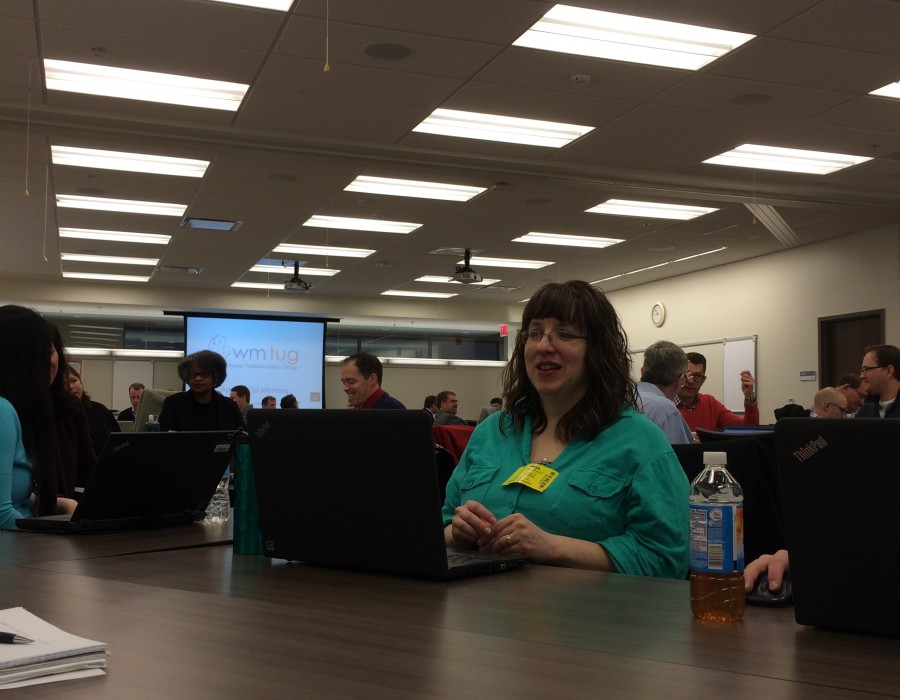
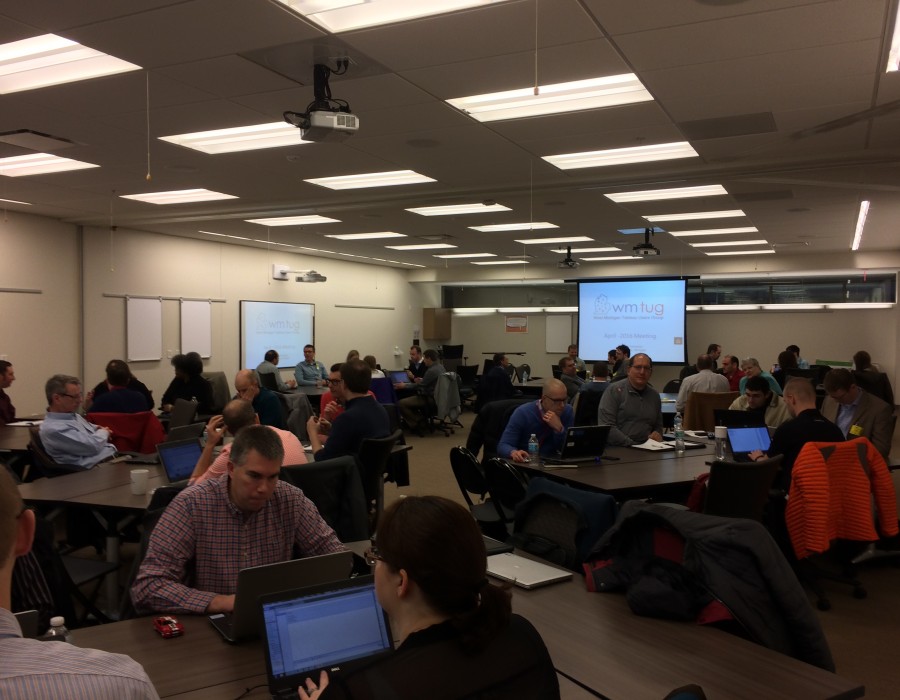
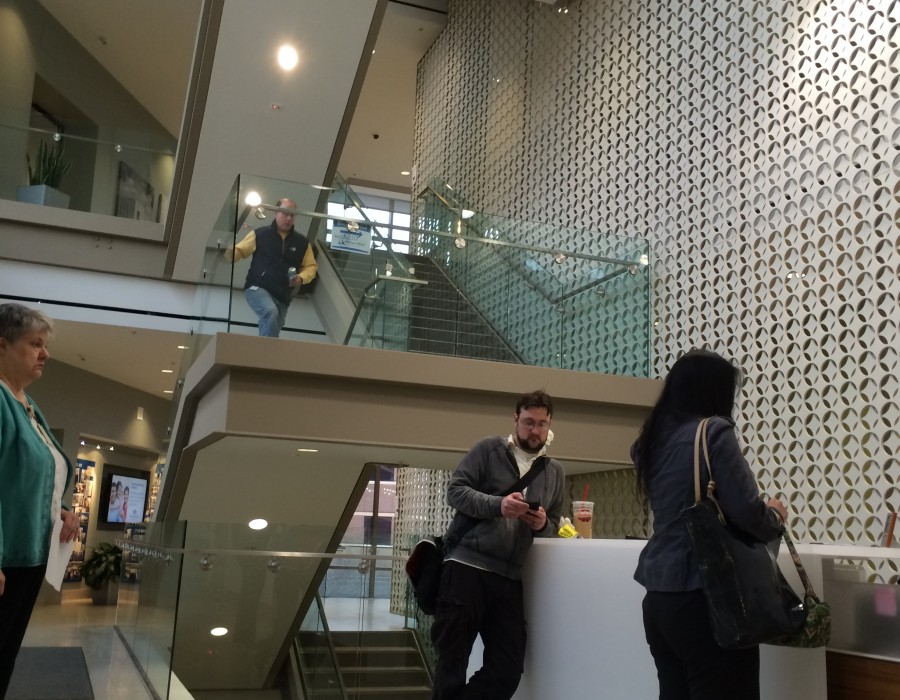
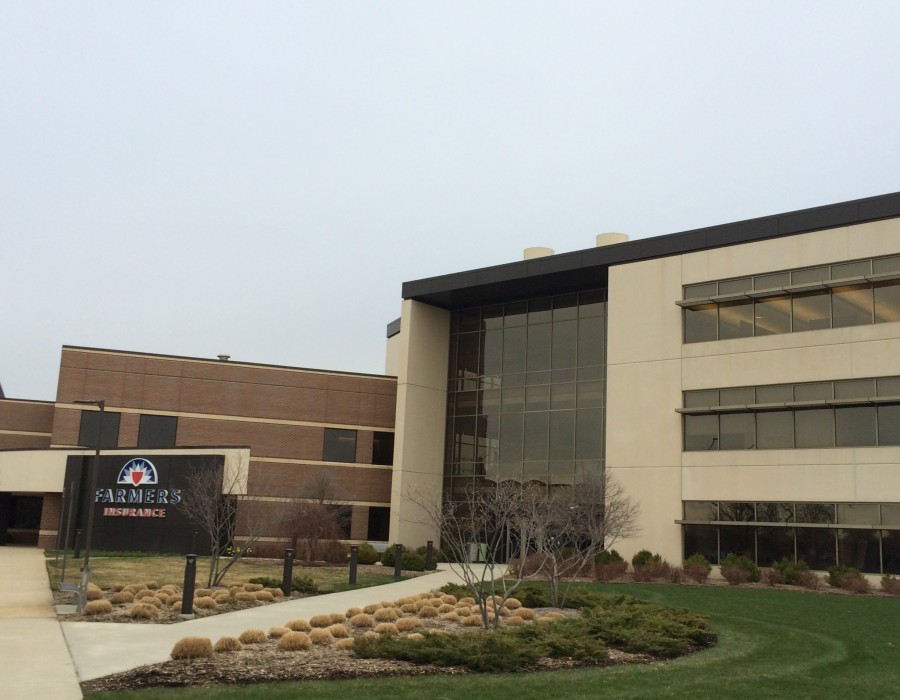
Here are some photos from the event: