New Edition, New Tour: US Dates for ‘Tableau Your Data! 2nd Edition’ Book Tour Announced

Posted - Jan 16th, 2016
Facebooktwittergoogle_pluspinterestlinkedinmailFacebooktwittergoogle_pluspinterestlinkedinmailTableau Your Data! Book Tour

In case you missed it, the 2nd edition of Tableau Your Data! is nearing release! This new edition features several updates and expansions to the best-selling guidebook which are current to the latest version of Tableau, Tableau 9.2. To promote this new release, author Dan Murray is hitting the road again for an extensive U.S. book tour. Dan will be dropping in on Tableau user groups (TUGs) across the country to discuss his book among other related data topics of interest. Each presentation will feature sections on:

  • Dashboards designed for discovery
  • Forecasting
  • Parameters
  • Data interpreter
  • Ad hoc calculations
  • Integrating other tools with Tableau (operationalizing sophisticated back-end tools like R and Python)

In addition to the core presentation, Dan will be participating in activities unique to each TUG.

Below is the current list of U.S. tour stops. Click on the event of your choosing to learn more and check back often as event registrations open:

Hopkins, MN Jan. 21 Cargill, Inc.
Houston, TX Jan. 25 BMC Software
Montgomery, AL Jan. 28 The Irish Bred Pub
Omaha, NE *CANCELLED DUE TO WEATHER* Feb. 2 Election Systems and Software
Madison, WI Feb. 5 CUNA Mutual Group
Stillwater, OK Feb. 16 OSU Foundation
Oklahoma City, OK Feb. 17 Addison Group
Columbus, OH *CANCELLED* Feb. 23 TBD
Milwaukee, WI Feb. 25 MGIC
Pittsburgh, PA Mar. 1 CMU
Raleigh, NC Mar. 3 Lenovo
Boston, MA Mar. 10 Broad Institute
Portland, OR Mar. 14 Cambia
Seattle, WA Mar. 15 Atrium Loft @ Pike Place Market
Bellevue, WA Mar. 17 Marquis Classroom
Berkeley, CA Mar. 22 UC Berkeley Soda Hall
San Jose, CA Mar. 24 Online
Phoenix, AZ Mar. 31 Wells Fargo
North Suburban Chicago, IL Apr. 5 Komatsu America Corp.
West Michigan Apr. 13 Farmers Insurance University Campus
Miami, FL Apr. 19 Kovens Conference Center
Atlanta, GA Apr. 21 Norfolk Southern Corp.
Chicago, IL Apr. 26 DePaul University
Baltimore, MD *CANCELLED* Apr. 28 TBD
Omaha, NE *RESCHEDULED FROM 2/2.* May 3 Creighton University
Kansas City, MO June 9 KU Edwards Campus
Washington, D.C. June 16 TBD

About Dan Murray

Based out of Atlanta, GA, Murray serves as Director of Strategic Innovation for full-spectrum data solutions firm, InterWorks. He holds over 30 years of business experience in key roles such as CFO, CIO, COO, VP of Planning and VP of Operations. Murray maintains a reputation as a leader in the fields of data visualization and business intelligence, particularly within the Tableau community, and was named a Tableau Zen Master in 2014. He helped create the first Tableau User Group in the U.S., in addition to founding several others.

About InterWorks

InterWorks is the leading data consulting and training firm to guide you on your journey with Tableau. Named the first Tableau Gold Partner, we continue to strive for excellence and have earned the title of Tableau’s VAR Partner of the Year for the past three years as well as Tableau’s Training Partner of the Year for 2015. From servers and visualization to development and custom tools, we cover the full spectrum of data needs through innovative solutions and proven expertise. Blending twenty years of experience, a multi-talented team and a drive for client satisfaction, we’ve helped countless organizations just like yours get further, faster and smarter with their data strategy.

Tableau Your Data! 2nd Edition Coming Soon

Posted - Nov 10th, 2015
Facebooktwittergoogle_pluspinterestlinkedinmailFacebooktwittergoogle_pluspinterestlinkedinmailTYD v2 copy

Author Dan Murray shares details about the 2nd edition of Tableau Your Data!

The 2nd Edition of Tableau Your Data! is in the final stages of proofreading. I expect to have galleys of the content from Wiley in the the next couple of weeks and then it will be into production for printing. This means the book should start shipping in the late December to January 2016 time frame. In fact, you can already pre-order your copy here.

This Is a New Book

When I started this project a year ago, I thought that updating a book would be much less work than writing the first edition. Tableau has added so many new features since v8.2 that writing an update that incorporates changes through v9.2 has been challenging. Keeping up with Tableau’s pace of development is not easy. The book is approximately 200 pages longer than the first edition.

Chapters 1-4: Introduction, Connecting to Data and Building Views

Due to the enhancements Tableau made to the connection interface, the Data Interpreter and calculations, these chapters have been extensively revised. I estimate about 80% of the content is new.

Chapter 5: Mapping

Tableau has added Mapbox integration, which is discussed in this chapter the old way because I updated the chapter prior to the release of the Mapbox connector. I discuss the connector in a general way and deleted old content. The chapter also covers new options related to the selector and the Map Option dialog updates that provide more control for the behavior of map panning and zooming. Tableau 9.2 also adds more map data.

Chapter 6: Developing an Ad Hoc Analysis Environment

This chapter expands coverage of data discovery with Tableau and the Data Interpreter.

Chapter 7: Tips and Tricks

I expanded this chapter to include additional tips and tricks that take advantage of new features added through v9.2.

Chapter 8: Dashboards

This entire chapter was updated, and the dashboard example was rebuilt and redesigned. Every action invocation type and removal behavior is now covered in the example dashboard.

Chapters 9 & 10: Stories and Designing for Mobile

These are two new chapters. In the first edition, these topics were covered in the dashboard chapter. Both chapters provided expanded content and updated examples to help you understand and utilize Stories better. They also provide tips that can help you create better dashboard designs for mobile consumption.

Chapters 11 – 13: Installing, Managing and Automating Tableau Server

The Tableau Server-related chapters have been updated with expanded coverage of the new features included in Tableau 9. Tableau has redesigned the backend of Server, increasing its capability. There is expanded coverage of the new processes that you need to consider when installing Tableau Server for the first time or expanding your Tableau Server footprint.

Tableau Server also provides more tools related to data governance and security that are covered and the Tableau APIs have matured, providing more ways for you to manage permissions remotely and automate repetitive processes. Power Tools for Tableau (our API-driven toolset) is discussed briefly with links to guide you to a free trial.

Chapter: 14 Case Study

I reduced the amount of case study content to a single example that should resonate with those of you who are trying to grow adoption of Tableau in your organization. The case study covers how to start and manage an internal Tableau User group in a geographically-disbursed team.

Appendix

The book’s appendix, which includes a function reference, has been updated and expanded to include all of the new native Tableau functions for Tableau.

It’s Worth All the Work

The second edition is really a new book that borrows as much as possible from the first edition, but it adds new content in every chapter and expands coverage of new features. At Tableau Conference 2015 in Las Vegas, dozens of people came to our booth to express their appreciation for the first edition. That’s what makes the ordeal of writing a book worthwhile! I hope you enjoy the second edition and find the new and expanded content to be even more helpful!

Dan Murray Gearing Up for a Big Q1 and Beyond

Posted - Feb 3rd, 2015
Facebooktwittergoogle_pluspinterestlinkedinmailFacebooktwittergoogle_pluspinterestlinkedinmail

Last year was huge for “Tableau Your Data!” author, Dan Murray. With the book picking up steam across the world, he spent a good chunk of his time on the road for several book tour stops across the US and Europe. Oh, and let’s not forget that he presented at the Tableau Conference and was named into the latest class of Tableau Zen Masters. Add in all the other conferences and data viz competitions in which he was a judge or presenter, and 2014 was easily one of his biggest years in data.

Breakfast with Hans Rosling and other Zen Masters in Seattle.

Above: Dan and other Tableau Masters talk with Hans Rosling at the 2014 Tableau Conference.

That’s all well and good, but 2015 is shaping up to be an even bigger year. Dan’s schedule is already jam-packed with several different events across the US. He’ll be speaking or presenting in some form or another at each event.

Below is a list of those events for Q1 and slightly beyond. See an event near you? Attend it. Click on the links to learn more:

Building a Data-Driven Organization Feb. 17 Portland, OR
Building a Data-Driven Organization Feb. 18 Boise, ID
Building a Data-Driven Organization Feb. 19 Oakland, CA
Tableau Partner Summit Feb. 25 – 27 Las Vegas, NV
Tapestry Conference March 4 Athens, GA
DRIVE Conference March 11 – 12 Seattle, WA
How to Build a Data Governance Strategy for 2015 and Beyond TBD New York, NY
How to Build a Data Governance Strategy for 2015 and Beyond TBD Chicago, IL
How to Build a Data Governance Strategy for 2015 and Beyond TBD San Francisco, CA
OSU BIG DATA Conference April 7 Oklahoma City, OK
INFORMS Conference April 12 – 14 Huntington Beach, CA
InnoTech Dallas April 16 Dallas, TX

That’s just the start. Dan will be squeezing even more events in the coming months, and you can expect the rest of his 2015 event schedule to look a lot like this. Check the blog often for more details and updates concerning specific events and more!

About Dan Murray

Based out of Atlanta, GA, Murray serves as Director of Business Intelligence for IT consulting firm, InterWorks. He holds over 30 years of business experience in key roles such as CFO, CIO, COO, VP of Planning and VP of Operations. Murray maintains a reputation as a leader in the fields of data visualization and business intelligence, particularly within the Tableau community as a Tableau Zen Master. He helped create the first Tableau User Group in the US in addition to founding several others.

2014 Year in Review – Books, Talks, Honors and More

Posted - Dec 17th, 2014
Facebooktwittergoogle_pluspinterestlinkedinmailFacebooktwittergoogle_pluspinterestlinkedinmail

Dan Murray reviews a busy year in the world of data.

In many ways, 2014 was a big and different year both for myself and for the entire InterWorks team. The team continues to grow and expand. I received recognition as a Tableau Zen Master, and was recognized by Tableau Software at Tableau’s first Partner Conference in Las Vegas as a Superstar Tableau Consultant.

Speaking took up a lot of my time this year. Most of the talks were solo, but I did do some events with my friend and fellow Tableau Zen Master, Andy Kriebel. Getting to know Howard Dresner while doing a series of talks for Tableau Software was a thrill too – Howard being the man that coined the term “Business Information.”

I also got to spend some time at a couple of conferences with industry guru, Mark Madsen, of Third Nature Consulting. Mark is a seasoned veteran with an encyclopedic knowledge of hardware and software. We met at a Pacific Crest Mosiac event and he joined the InterWorks team for dinner at DATA14 in Seattle.

Significantly our development team launched Power Tools for Tableau, a family of add-on products that enhance Tableau Server and Tableau Desktop. More will be coming in Q1 2015 to Power Tools for Tableau.

As you can imagine, I took a lot of photos during my travels this year. You can thumb through some of them in the slideshow below:


Highlights from 2014

Here are some notable happenings from this year:

Writing

  • “Tableau Your Data!” is a Best Seller
  • Wrote 16 blog posts
  • Wrote one white paper
  • “Tableau Your Data!” used as a textbook
  • Book translated into Simplified Chinese
  • Started Second Edition of “Tableau Your Data!”
  • Outlined another book for future publication

Honors

  • Recognized as a Tableau Zen Master
  • Recognized by Tableau as a Superstar Tableau Consultant
  • Closed the NYSE at the Tableau Conference in Seattle

Talks / Conferences

  • Attended six conferences
  • Gave 59 speeches
  • Gave three virtual speeches

Notable Meals

  • Had breakfast with Hans Rosling
  • Had dinner with Howard Dresner
  • Had dinner with Mark Madsen

Other

  • Did 21 consulting gigs
  • Added 38 people to the team
  • Over 1,200 projects billed this year
  • Launched Power Tools for Tableau
  • Launched iOS and Android apps for Tableau Server
  • Had one gallbladder removed

What’s in Store for Me in 2015

Since founding the Tableau/BI team at InterWorks, my title has been Director of BI Services. This year, I spent two weeks running the team. Most of my time went into speeches, field consulting, writing and book tour events.

My role at InterWorks has changed. I’m going to continue to write books, create blog posts and give speeches. My title in 2015 will change to reflect this new role. I’m excited about the entire data and data visualization market over the next five years. The Hadoop ecosystem continues to evolve, which is particularly interesting. It is an exciting time to work in data. I look forward to 2015!

On another note, our company Holiday Party is the only event of the year in which every InterWorks employee is in the same physical place. It’s such a joy to work with the entire team, and it was great to see everyone. I’m impressed with our new team members and the overall strength of our crew. InterWorks is a great place to work, and it just keeps getting better!

I leave you with some fun videos. The first is Tableau Software closing the NYSE. The second is me doing the ALS Ice Bucket Challenge.


Dan Murray Joins Tableau for ‘Building a Data-Driven Organization’ Event Series

Posted - Sep 16th, 2014
Facebooktwittergoogle_pluspinterestlinkedinmailFacebooktwittergoogle_pluspinterestlinkedinmail

Speaking at SFBATUGTC14 may have just ended, but the Tableau events keep rolling. Their newest series of events focuses on building data-driven organizations through the power of data visualization in Tableau. The events will feature Tableau’s latest Zen Master, Dan Murray, who possesses extensive and diverse experience on the subject. The ultimate goal of each event is to show organizations how a data-driven culture can lead to powerful insight and growth.

“I hope to inspire new users to download the trial and finish a project in their first 30 days,” said Murray.

The event series stretches across six cities in the Western US and Canada. Each event features an interactive discussion, a keynote speech from Murray, panel Q&A and plenty of networking time.

Click on the event of your choosing below to learn more:

Scottsdale, AZ Sept. 17
Santa Clara, CA Sept. 18
Denver, CO Sept. 19
Calgary, AB Sept. 23
Los Angeles, CA Sept. 24
Las Vegas, NV Sept. 25

About Dan Murray

Based out of Atlanta, GA, Murray serves as Director of Business Intelligence for IT consulting firm, InterWorks. He holds over 30 years of business experience in key roles such as CFO, CIO, COO, VP of Planning and VP of Operations. Murray maintains a reputation as a leader in the fields of data visualization and business intelligence, particularly within the Tableau community as a Tableau Zen Master. He helped create the first Tableau User Group in the US in addition to founding several others.

Dan Murray Featured on ‘Tableau Wanna Be’ Podcast

Posted - Sep 6th, 2014
Facebooktwittergoogle_pluspinterestlinkedinmailFacebooktwittergoogle_pluspinterestlinkedinmail

Dan Murray was featured in Episode 5 of the “Tableau Wanna Be” podcast hosted by Matt Francis and Emily Todd Kund. The podcast focused on the previewing TC14 as well as an in-depth interview with Murray about his book, traveling the globe and the upcoming conference. You can listen to the podcast below or read through the summary of Dan’s interview immediately following.

Emily sat down with Dan Murray at a Starbucks in Washington D.C. to discuss a number of Tableau topics, including:

  • How “Tableau Your Data!” came to be
  • Highlights from the TYD book tours
  • What Murray is looking forward to at TC14
  • Advice for conference goers

Why Write a Book?

Emily and DanEmily and Dan.

Emily opened her set of questions by asking Murray why he wanted to write a Tableau book in the first place. Murray explained his desire to write a data book began six years ago, but folks like Tableau and Microsoft weren’t interested in funding a book and a book tour at the time. Fast forward a few years later. Dan was contacted by Elissa Fink from Tableau who asked if he still wanted to write a book. Fink connected Murray with publisher Wiley and Dan began writing “Tableau Your Data!”

Book Tour Impressions, Objectives and Takeaways

The next few questions were focused on the US and European “Tableau Your Data!” book tours:

  • What was the most rewarding aspect of the tour?
  • What was the usual response when finishing a talk?
  • What was the objective of the tour, aside from promoting the book?

For Murray, the most rewarding part of the tour was meeting so many people he wouldn’t have met otherwise. He enjoyed seeing the enthusiasm people had for Tableau. Europe was especially interesting to Murray because Tableau is just now catching on.

“In Europe in particular, it’s like the US four years ago. It’s the crazy people there that are really loving Tableau … it’s a lot of fun.”

Concerning audience response when finishing a talk, Murray laid out an interesting landscape which broke audience members into two categories. There are those who love Tableau, and then there are IT guys who are trying to make it work in their environment. Murray detailed his conversations with the latter, expressing how they try to make Tableau work with their old technology. He summed it up perfectly in this quote:

“One of my favorite questions is ‘how do I do cubes with Tableau?’ That’s a little bit like saying ‘how do I build buggy whips for my car?’”

As far as the tour objective, Murray said his goal was simple: He wanted to meet as many interesting people as possible. He explained that the influx of new Tableau users and partners are adding many new perspectives into the Tableau community. Dan and Emily carried the idea of new perspectives into the book publishing market. They discussed whether or not it was possible to oversaturate such a market with Tableau books. Murray pointed to examples like Microsoft Excel books, of which hundreds are published each year. Concerning Tableau, Murray welcomed to the growing number of books:

“If you have something to say that’s not in the manual, that’s when you have something to write about.”

Murray and Emily agreed that with so many different perspectives, there was plenty of room for many Tableau books in the future. Each book appeals to different types of users and have their own intrinsic value. Speaking of books, Murray also mentioned that he’ll be working on his second book shortly.

Tableau Conference Chatter

Given that Dan has been to every US Tableau Conference and most worldwide, Emily asked Dan what he was looking forward to most at the 2014 Tableau Conference. The answer struck a similar tone that of his book tour: He enjoys seeing people he almost never sees.

“I like the people more than anything.”

He recounted meeting Andy Kriebel at the very first Tableau Conference and how they’ve been friends ever since. He’s made new connections at every conference. Murray went on to say that he really enjoys the customer sessions. Of course, Christian Chabot’s keynote speech is always great. When asked about tips for beginners, Murray recommended staying after sessions ended to ask genuine questions to the presenters. For seasoned pros, Murray recommended meeting as many new people as possible.

“The newest people bring different ideas.”

Three Wishes for Tableau

Emily closed out her interview with Dan by asking him what his three wishes for Tableau or data visualization would be. The only condition was no unlimited wishes. Murray’s choices were:

  • Parallel processing of queries in Tableau
  • For Tableau to go towards the data by making “data munching” easier for non-technical users
  • Make tableau calculations simpler and more powerful

Murray and Emily agreed that the smart folks at Tableau have surely been thinking the same things, and are confident that the software will only get better as time goes on.

Thoughts on Becoming a Tableau Zen Master

Posted - Sep 5th, 2014
Facebooktwittergoogle_pluspinterestlinkedinmailFacebooktwittergoogle_pluspinterestlinkedinmail

Dan Murray shares thoughts on becoming a Tableau Zen Master and the journey that took him there …

About a month ago, I received a small box in the mail with an announcement in it. I was both surprised and thrilled to be voted a “Tableau Zen Master.”

Here’s my official announcement.

Since hearing the news from Tableau, I’ve thought about the reasons why it might have happened. There are the obvious and recent factors, which include writing a book as well as speaking all over North America and Europe during the past 10 months. Or, perhaps it’s because I know most of the previous Zen Masters very well.

Joining Some Friends

Joe Mako, Andy Kriebel, Anya A’Hearn, Chuck Hooper, Craig Bloodworth, Jonathan Drummey, Ryan Robitaille and Steve Wexler are all friends. Some of them are close friends. I’ve admired the work of Kelly Martin, Mark Jackson and Ramon Martinez, and I look forward to reviewing the posts they write and the knowledge they freely share. Richard Leeke consistently offers some of the best technical insight about the inner-workings of Tableau that I’ve seen anywhere. Jen Underwood is a consultant based in Florida that has written some very useful posts comparing different visualization tools. I’ve enjoyed reading them and found them to be helpful. Although I don’t know Allan Walker, his Tumblr site has mapping covered with some very insightful plots. Most recently, he shared an aircraft tracking render.

The common thread for all of these folks is that they have given something back to the community and freely share their knowledge. It is a real honor (and responsibility) to be included in this group along with the other new Zen Masters, many of whom are also friends.

zen-masters

Above: Some of last year’s Zen Masters in the TCC13 photo booth.

My Story with Tableau

My use of Tableau started in 2007 before I became a consultant. It wasn’t obvious then that Tableau was going to take the BI World by storm. It wasn’t nearly as capable in V3.5 as it is today.

Tableau fit my needs perfectly back then. It provided a means for my team (along with InterWorks) to deploy a solution for less than 10% of the cost of more traditional BI platforms and with far less weekly effort than Excel. After finishing that project, I felt that Tableau Software had invented the next great tool (the first great tool was Lotus 123 in 1982).

After convincing the founder of InterWorks, Behfar Jahanshahi, to hire me, we started the first BI consulting practice built around Tableau. I proceeded to fail miserably in delivering on any of the goals we’d established for the first year of the practice. After that, my salary went to zero. I was 100% incentive. Being stubborn helps if you want to start something new.

IW Team Meeting

Above: The ever-growing InterWorks BI team meeting before TCC13. I’m the one standing on the left.

What I learned in that first year of consulting was that Tableau’s value wasn’t really obvious to other people. Most people saw it as a charting tool. For those of you who love to do the deep dive into unknown data sets, you know that Tableau is much more than a “charting” tool. It’s a discovery engine. All of the best stories I’ve heard about Tableau successes are discovery stories.

I was on the 100% commission plan for about six months. In the third month, I generated just over $27,000 in consulting fees myself. Ever since that date, we’ve been on a very consistent upward trajectory. Today, the InterWorks BI team has 70 team members spread from the West Coast of North America to Europe. We’ve done over 1,000 projects in the last six years. Our clients include the most well-known and highly-regarded companies in nearly every industry vertical, even education and government. My team includes some of the smartest and nicest people I’ve ever had the pleasure of working with in my career. I feel truly blessed to be associated with everyone on the InterWorks team.

A Data Community Like No Other

For those of you that have a passion for data, there is no better community in the world for learning and sharing your ideas than the Tableau community. If you want to join in the fun and the discovery, I’ll leave you with this advice from Charles Bukowski:

CharlesBukowskiSq


“Find what you love and let it kill you.”

Dan Murray Named ‘Tableau Zen Master’

Posted - Sep 5th, 2014
Facebooktwittergoogle_pluspinterestlinkedinmailFacebooktwittergoogle_pluspinterestlinkedinmail

Tableau Software, one of InterWorks’ largest and closest partners, honored Dan Murray today with the title of Tableau Zen Master. Murray is InterWorks’ very own Director of BI Services, leading a massive team of business intelligence experts. The title speaks to Murray’s massive influence on the Tableau community.

“It really is an honor to join the ranks of Tableau’s Zen Masters,” said Murray. “These folks are a big reason why Tableau is what it is today. Plus, they’re just genuinely good and intelligent people.”

What Is a Tableau Zen Master?

The title of Tableau Zen Master is bestowed onto Tableau leaders, teachers, trainers, bloggers and evangelists who consistently make a positive impact on the Tableau community as a whole. Through their actions and insight, they have spread Tableau wisdom to a level above and beyond expectation. Quite simply, they’re the brightest minds in data.

A Brief Background of Dan Murray

NYC Tumblr HQSince discovering Tableau in 2007 and founding InterWorks’ BI consulting practice, Murray has helped hundreds of organizations make the most of Tableau and their data. These clients include the likes of Facebook, Cisco, Rosetta Stone and more. His leadership transformed InterWorks into the largest and most respected Tableau services partner in the world.

At the community level, Murray co-founded the very first Tableau User Group in the US – the Atlanta TUG. Murray went on to use the Atlanta TUG as a model to help other TUGs across the country get started. He recently shared advice for starting a successful TUG at the Tableau Conference on Tour in London with fellow Zen Master and Atlanta TUG co-founder, Andy Kriebel. Whether it’s consulting, speaking or blogging, Murray loves sharing his Tableau knowledge with the vibrant Tableau community.

The Ultimate Tableau Guide, “Tableau Your Data!”

Drawing from his extensive Tableau experience, Murray wrote the acclaimed guidebook, “Tableau Your Data!” The book features detailed use cases, best practices and several tips for those wanting to make the most out of Tableau.

The book was met with rave reviews, including praise from data legends like Chuck Hooper. It was also officially endorsed by Tableau, with CEO Christian Chabot giving the foreword. The book continues to gain traction, with Tableau classrooms everywhere adopting the book as their core curriculum.

Tableau Advocacy Around the World

Murray spent the past year traveling the globe as part of the “Tableau Your Data!” book tours. He visited TUGs across the US and Europe to share his unique insight and experiences. Along the way, Murray judged events like Chicago MigraHack, Midwest VizWars and Facebook Viz Cup II. He also led several private talks at a number of Fortune 500 companies. Murray recently detailed tour experiences and TC14 tips with Matt Francis and Emily Todd Kund on the “Tableau Wanna Be” podcast.

Boston TUG

Above: Murray speaking at the Boston TUG.

Through his continued evangelism and contribution to the Tableau community, Murray has certainly earned his place among Tableau’s revered Zen Masters. Murray aims to use his Zen Master status to extend Tableau’s reach further, connecting more people to their data with the power of data visualization.

Check out the official Tableau Zen Master release, featuring the full list of this year’s Zen Masters.

A Recap of the US “Tableau Your Data!” Tour

Posted - Jul 3rd, 2014
Facebooktwittergoogle_pluspinterestlinkedinmailFacebooktwittergoogle_pluspinterestlinkedinmail

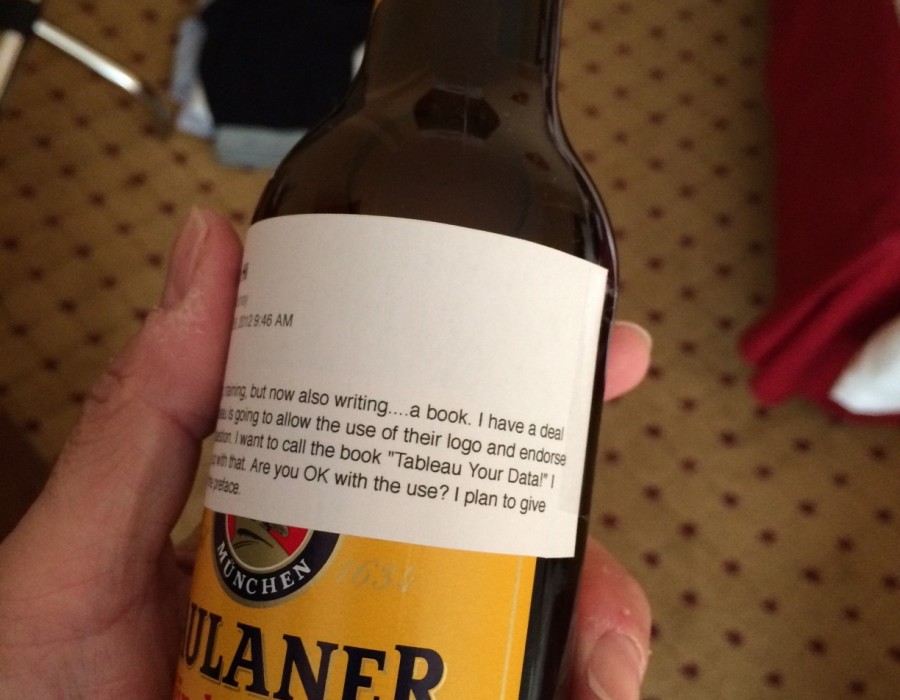
In Nov. of 2013, I started the “Tableau Your Data!” speaking tour in Omaha, NE. This tour culminated with the talk in Pittsburgh, PA last week.  I had the privilege of being able to talk Tableau to fellow users across the country. Along the way, I met some fantastic people, witnessed cool new ways these people are using Tableau and simply had a great time.

I have three more talks scheduled for North America in Aug. and Sept. These include Atlanta, Washington D.C. and a virtual session talk with Cigna. Before finishing out with those talks, I’m taking the tour to Europe. Before I do that though. I wanted to share some insight from the U.S. portion of the tour. I’ve given a brief recap of each event below. I hope you guys had as much fun as I did on this tour!

Omaha TUG

Nov. 7, 2013

I did this first early-edition talk because Mike Moore asked me to do one. My later talks had very little in common with this early edition, which spent too much time on Hadoop. There were around 50-60 people in attendance, including a couple of Tableau field staff members from Denver, CO.

Indianapolis TUG

Jan. 14, 2014

This event was hosted by a new Tableau Partner, Apparatus. There were around 50 people in attendance. The event took place on a basketball court in Apparatus’ facility. Apparatus is a well-established Microsoft Partner. I met several of their employees and got a tour of the facility. The audience was engaged. A local investment company was also in attendance (I had coffee with this Pacific Crest client before the talk). Also notable—Rob Joyce called me and wanted to know how things were going. After my speech, I had dinner with my sister, Leslie, in Indianapolis.

Indianapolis TUG

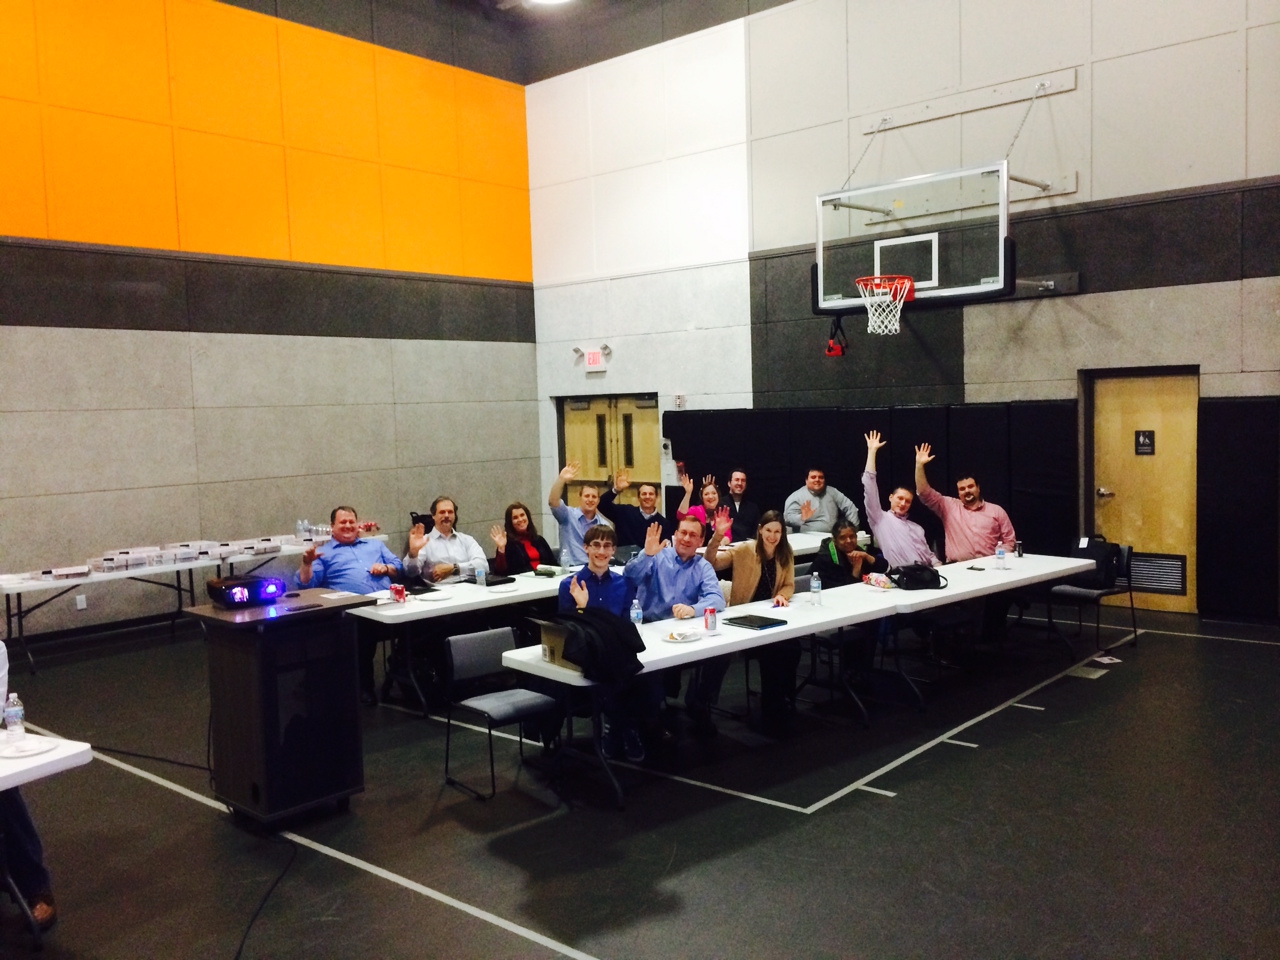
Above: The Indianapolis TUG meeting on a basketball court.

Raleigh TUG – Duke University

Jan. 16, 2014

This was a very nice location in an old tobacco warehouse. This TUG was a smaller group (around 30 people), but included clients like Cisco, Blue Cross Blue Shield and others. After the talk had ended, I went to a wine bar with about 15 of the attendees and had some very good discussions with some very smart folks. The only person missing was @Lewandog.

Minneapolis TUG

Jan. 21, 2014

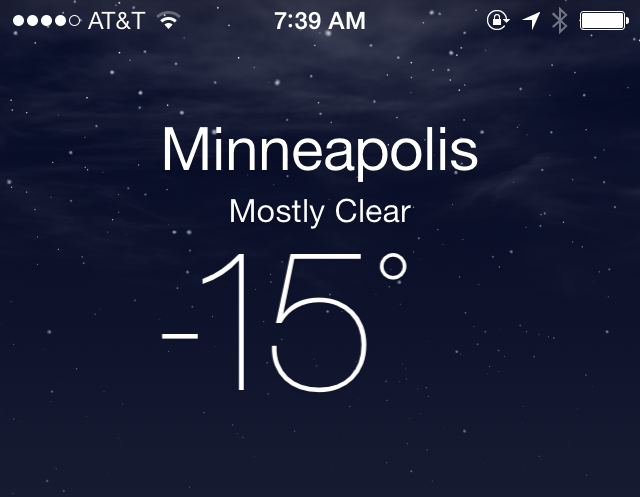
This was the only time I’ve ever given a speech with long underwear on. The high temperature for the day in Minneapolis was -15 degrees. Over 125 people actually came to the talk, including clients like Target and Delta Airlines. There were very engaged people who stayed after the talk to ask questions.

Madison TUG

Jan. 23, 2014

This was a smaller group of people (around 30), but some of them were highly-motivated. InterWorks sponsored the venue, and a small one-man partner, Patrick McCormick, ran a very good TUG meeting. Nice guy. I had dinner with him, and we talked extensively. I also met Sarah Nell of AE Business Solutions (Milwaukee) here for the first time. Overall, it was an engaged and intelligent audience focused on education and health care.

Milwaukee TUG

Jan. 24, 2014

This talk was held at a Tableau Partner office (AE Business Solutions) with their very enthusiastic Tableau consultant, Sara Nell. About 35 people were in attendance. By then, the temperature had warmed-up all the way to -2 degrees. Harley Davidson had several people in attendance, which was notable because Tableau Software had just beat-out QlikTech to land a very big deal there. QlikTech was rumored to have dropped their prices significantly below Tableau. Tableau held firm and won the deal. I asked one of the Harley people why they selected Tableau. The answer? Despite the big discrepancy in upfront cost, they believed that Tableau would offer a lower total cost of ownership.

Boston TUG – The Broad Institute

Jan. 28, 2014

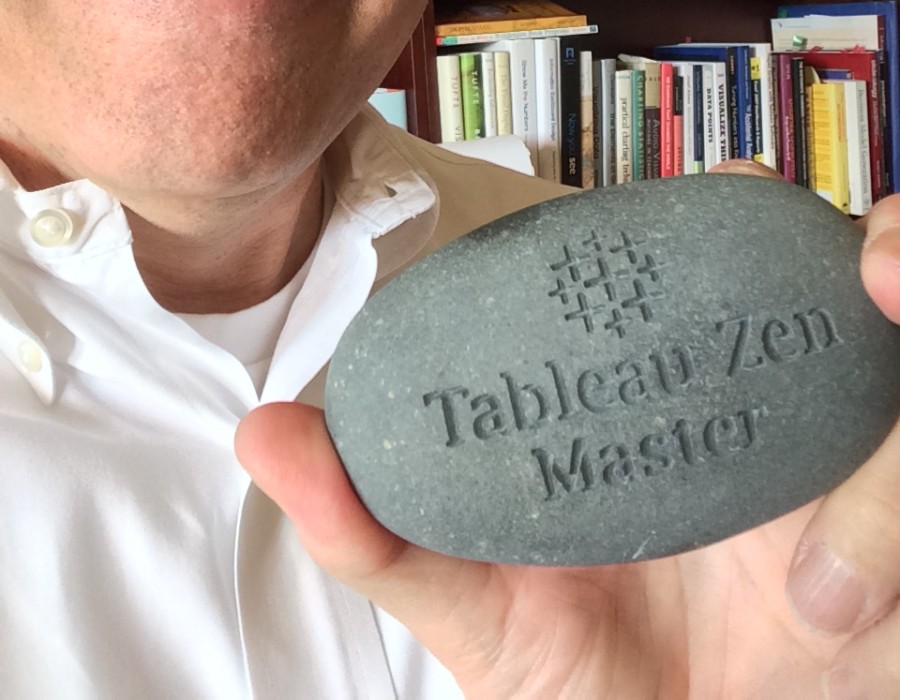
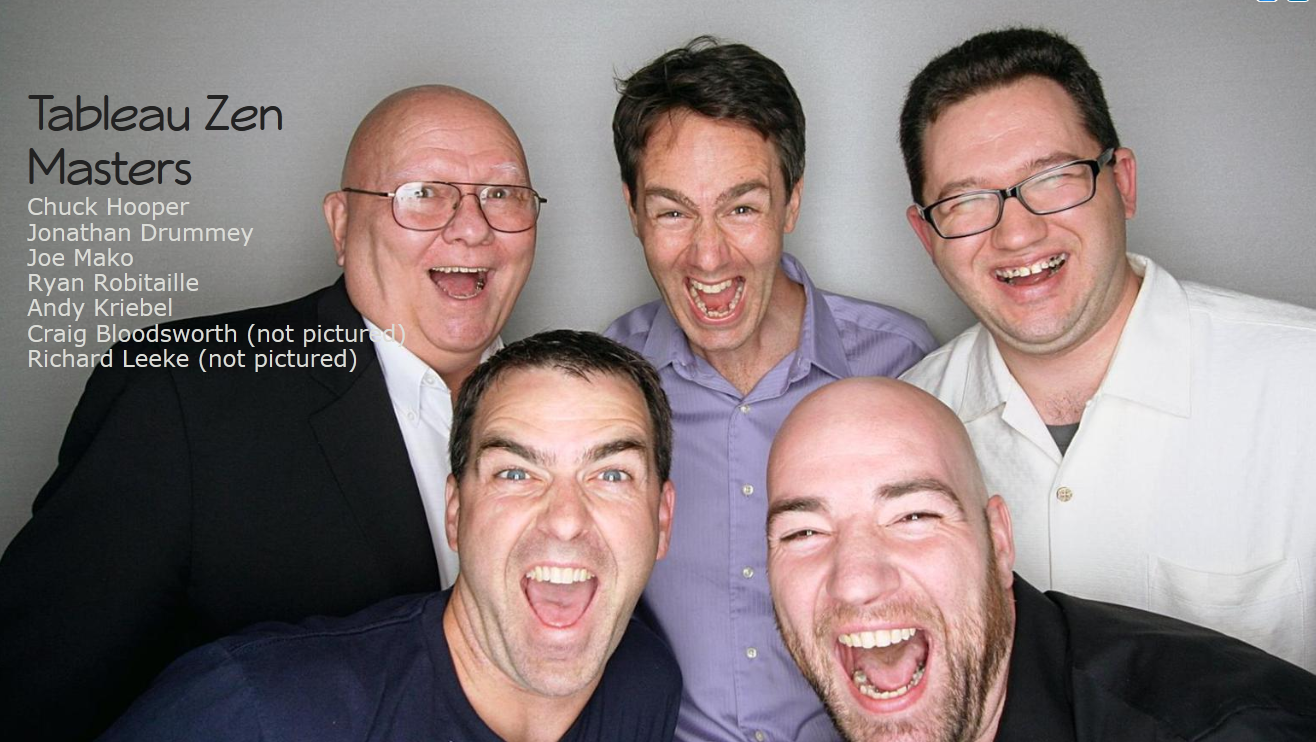
One thing about giving a talk at a genome research institute directly adjacent to Harvard University and MIT—the audience is going to have a lot of smart biotech folks. In this case, there were also a couple of Tableau Zen Masters and friends there—Chuck Hooper and Jonathan Drummey. Aside from having the honor of speaking there, I saw one of the most interesting talks from Tableau customer, New England Biolabs. Nicole Nichols and Josiah Grimes use Tableau to improve the quantity and quality of data analysis related to DNA Polymerase development. They had fascinating visualizations.

Boston TUG

Above: Speaking at the Broad Institute to the Boston TUG.

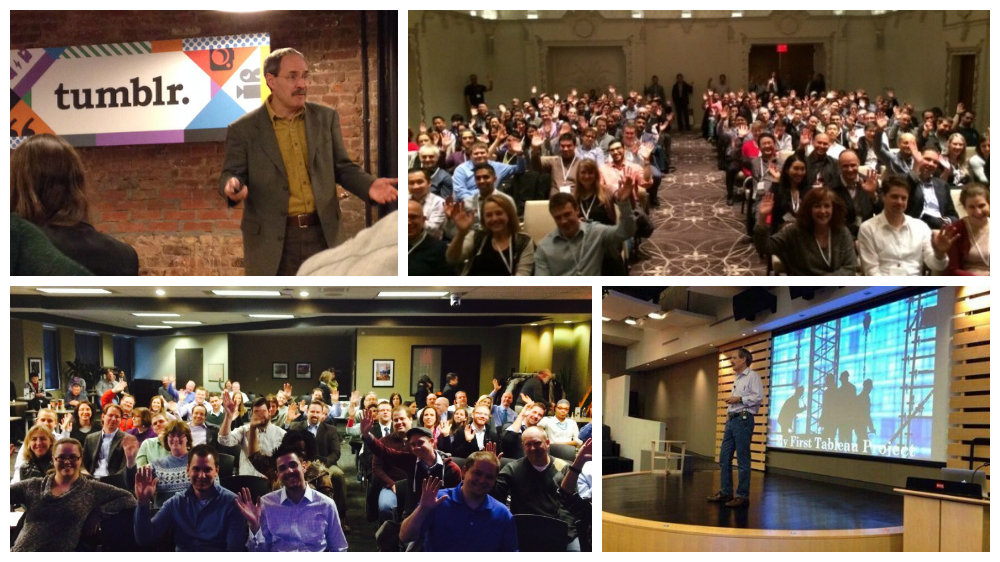
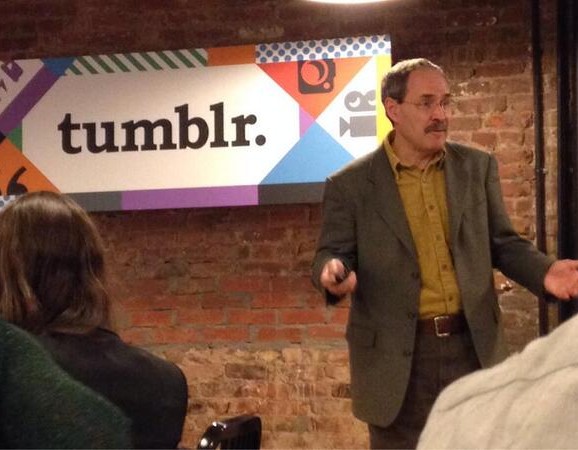
New York – Tumblr HQ

Jan. 30, 2014

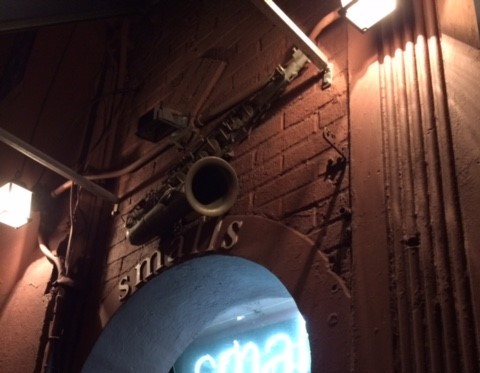
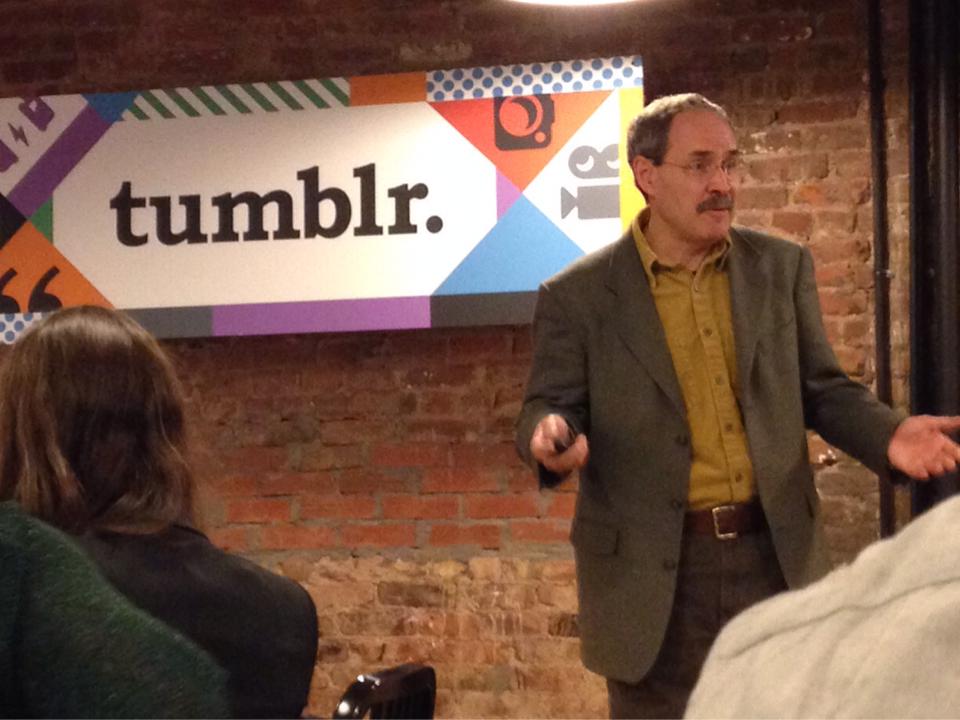
I didn’t realize that the talk was scheduled at Tumblr’s HQ until I arrived at what looked like a condo building. Going up the elevator, I thought that I was in the wrong place. Then, when I arrived at floor whatever, the doors opened and a Tumblr logo greeted me. About 60 people attended, and the post-talk Q&A was active and engaging. After that, James Wright and I went to dinner with Lee Feinberg. We followed that with a trip to the Village to hit up Smalls. Fun trip.

Portland TUG & Nike Talk

Feb. 11, 2014

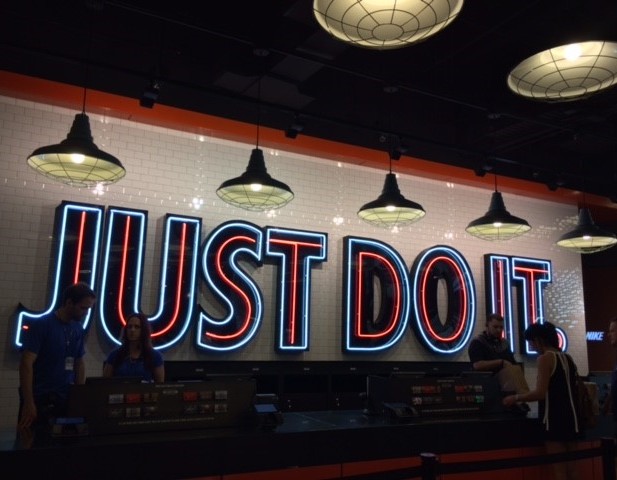
One of the absolute highlights of the tour in North America was my visit to Nike. I actually did two different talks there. In the morning, I spoke to the Portland DAMA (Data Management Association) in the Steve Prefontain Amphitheater. It was a very nice venue. In the evening, I spoke in a smaller room to the Portland TUG. Check out our video of the full presentation. Overall, I would estimate that around 150 people attended. The engagement of both audiences was very high. Several Nike employees brought their laptops and wanted to show me their “very cool” work. There are several striking things about Nike:

  1. They are very friendly people
  2. They are willing to try new ideas
  3. They take technique and extend it in novel ways

Their data team is excellent, and for a big company, they jump silos with aplomb. Nike is a special place.

Portland TUG

Above: Presenting to the Portland TUG in the morning.

Kansas City TUG

Feb. 18, 2014

I didn’t expect the relatively large crowd in a smaller city, but around 70 people came to this talk. I had the good fortune to have dinner on the first night with Tableau Viz Contest winner and founder of the user group, Ryan Sleeper. Ryan is passionate about data visualization. Another notable attendee was my friend, Mike Moore, from GOTUG. Mike had recently moved from West Communications to Kiewit Corporation. Mike brought a co-worker and his boss. I ended up going to dinner with the three of them, geeking out on data visualization and dashboarding for a few hours into the night.

Phoenix TUG – AAA Glendale Ops Center

Feb. 20, 2014

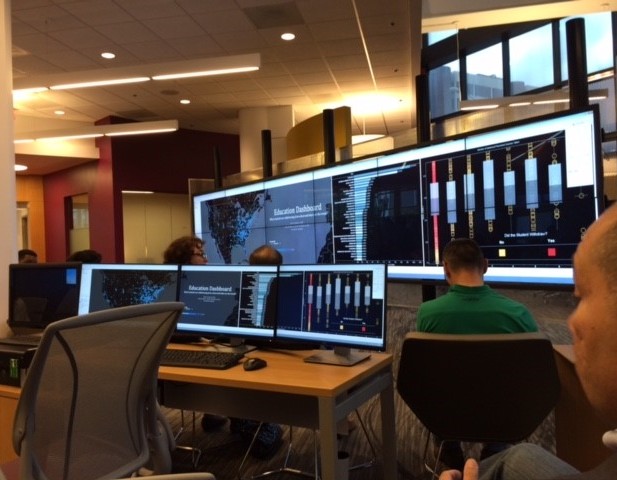
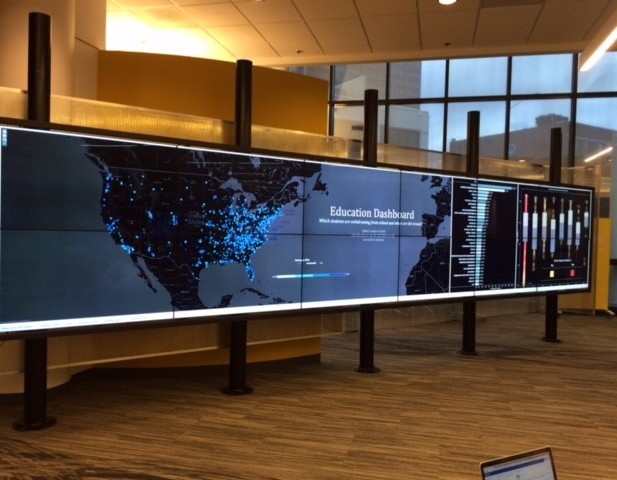
My talk to the Phoenix TUG was for a very small audience (around 20 people,) but the ones that came were very engaged. Because the room was small, there was a lot more interaction than normal with the audience. Ken McBride, also came to the meeting, and we went to dinner with three of the attendees after the talk was over. One of the highlights for me was meeting Gessica Briggs-Sullivan. Gessica is an analyst at AAA. She was their first Tableau user and the real driver that moved Tableau into their data culture. The other highlight was seeing AAA’s amazing data center, which contained an 80’ wide dashboard wall (there were at least 20 dashboards being displayed here) that contained at least five separate Tableau dashboards that were monitoring vital network status reports for their North American operations. I haven’t seen anything like it before. It reminded me of a NASA Flight Operations Center. It was very impressive.

San Diego TUG

Feb. 28, 2014

San Diego was my first (and last) Friday evening talk. The audience was very small (around 10), but also the most technically knowledgeable. In addition, the other speaker that night was one of the principals of Import.IO, Andrew Fogg. He is the founder and CDO of the company. He did a really nice demonstration of their product (which is totally free). This product reminded me of a tool that I used in the 1980’s for extracting greenbar mainframe reports into Lotus 123 (Monarch – now owned by IBM). Of course, Import.IO is thoroughly modern and built for the web. I see this as a very nice tool for scraping data from web pages.

Nashville TUG – Vanderbilt University

Mar. 6, 2014

This was a very weird trip. I had to come from San Francisco via Atlanta on a Redeye. When I arrived in Nashville, I “Ubered” my way to a breakfast place. When I arrived at the hotel, I called Behfar to discuss events of the day. While I was looking out the window, talking with him, I watched in horror as a homeless man was run over twice by a pizza delivery driver. Amazingly, the guy got up, shook the driver’s hand and went back to dumpster-diving. I went to sleep and woke up a few hours later to get ready for my talk. I saw the homeless man pushing a grocery carriage up the alley while he walked with a very pronounced limp. Just another day at the office for this poor fellow.
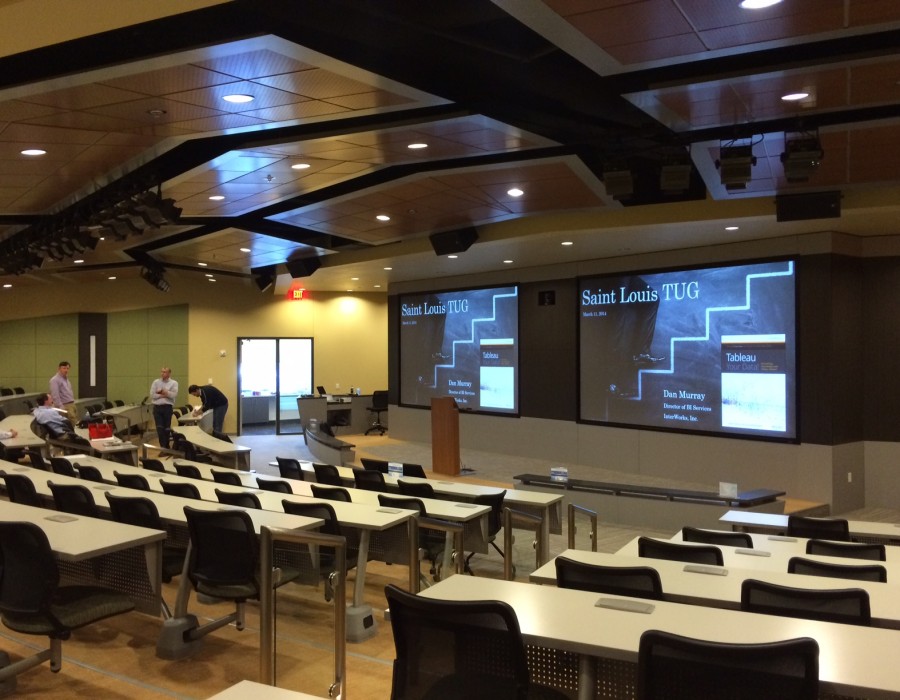
Saint Louis TUG

Mar. 11, 2014

This talk attracted around 80 people to a really wonderful venue at World Wide Technologies’ brand new corporate headquarters. This consulting company must have invested around $25 million in a brand new demo center. I toured the facilities with a couple of WWT Consultants. They are just getting started in the Tableau world, but this is a company with impressive credentials. I was impressed with the size, scope and quality of their HQ.

St. Louis TUG

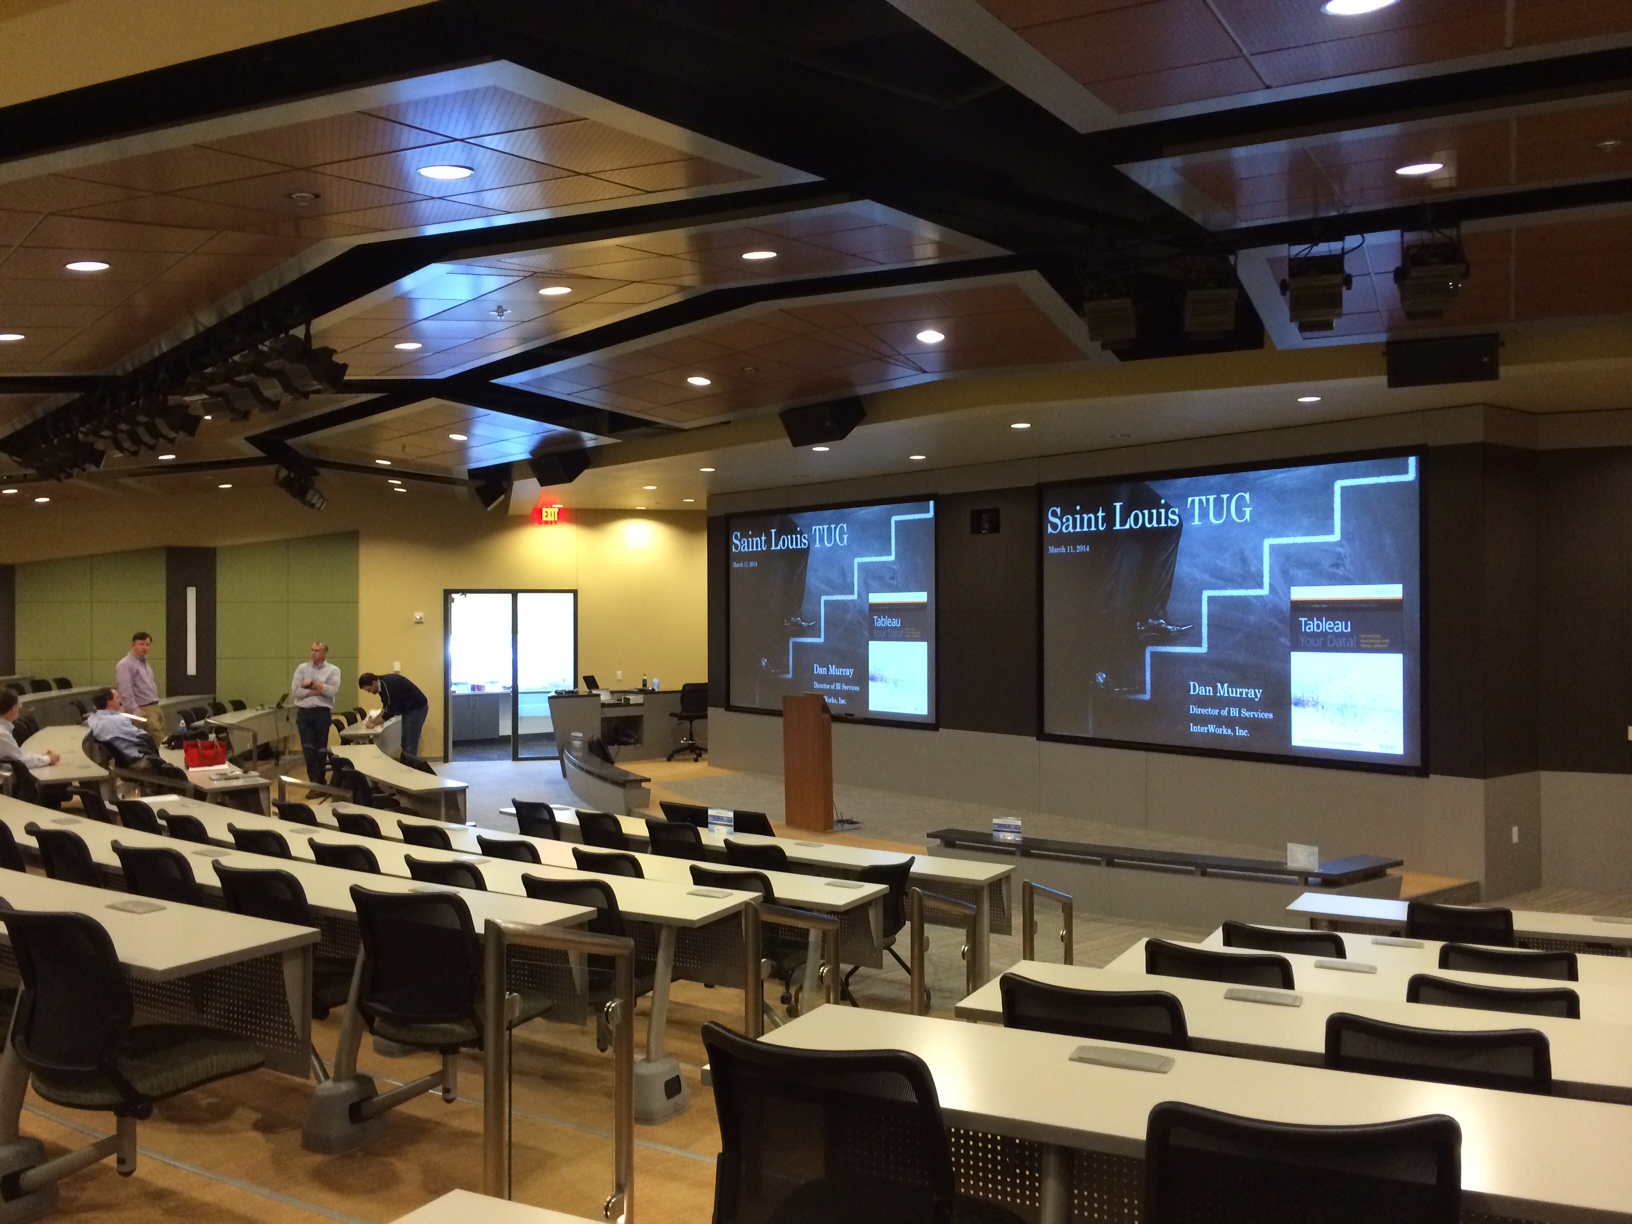
Above: Preparing for the Saint Louis TUG meeting.

Philadelphia TUG

Apr. 8, 2014

This was my first talk after having gall bladder surgery. It was also my birthday. So, that might give you a clue as to how much I’ve enjoyed giving these talks, meeting Tableau users and new Tableau Partners. This talk was sponsored by a new Tableau Partner, Acumen Analytics, and was hosted at a local public television station, WHYY Public TV. George and Kathleen Brunner are husband and wife, and they’re the leaders of Acumen. They were delightful hosts, and we had a lot of fun sharing data war stories. Thank you, George and Kathleen!

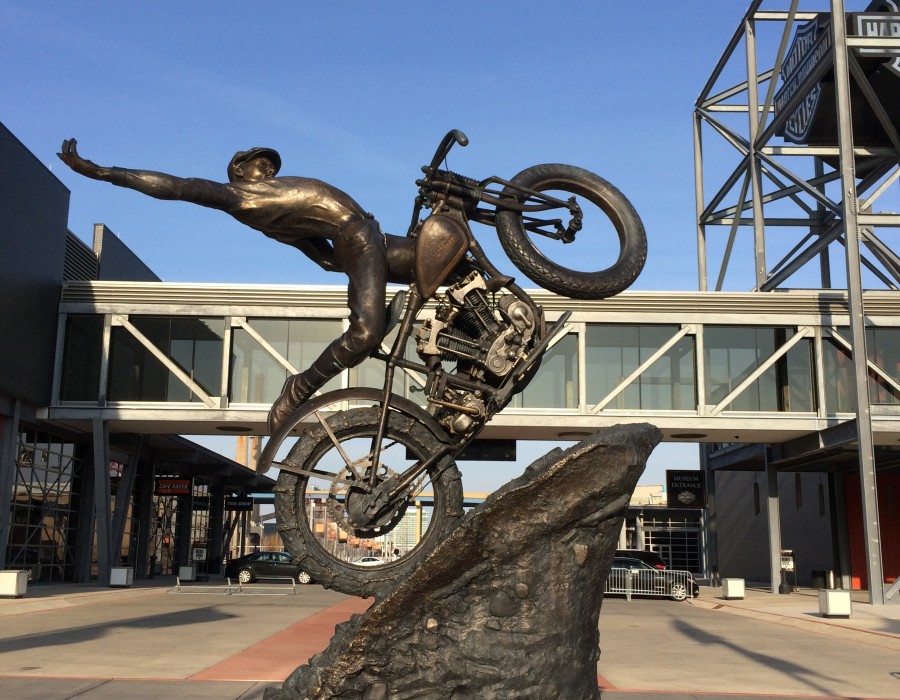
Midwest VizWars – Harley Davidson Museum

Apr. 10, 2014

After meeting Sara Nell at my Milwaukee and Madison speeches, her employer and Tableau Partner, AE Solutions, invited me to judge a VizWars contest. This was held at the Harley Davidson Museum in Milwaukee, WI. The museum is a very cool place. Whether you’re into motorcycles or not, I highly recommend the tour. Three winners were selected, but the highlight of this event for me was a brand new Tableau user, Barb Holschbach, from the University of Wisconsin at Green Bay. Barb had about one hour of experience using Tableau and was able to build a dashboard. She had the guts to get up in front of 100 people to show off her creation. That takes some guts when you’re competing against 80 more experienced Tableau gurus. I decided to give her an honorable mention and a free copy of my book. Well done, Barb! If that doesn’t demonstrate how easy Tableau is to learn and use, I think nothing will.

Harley-Davidson Museum, Milwaukee, WI

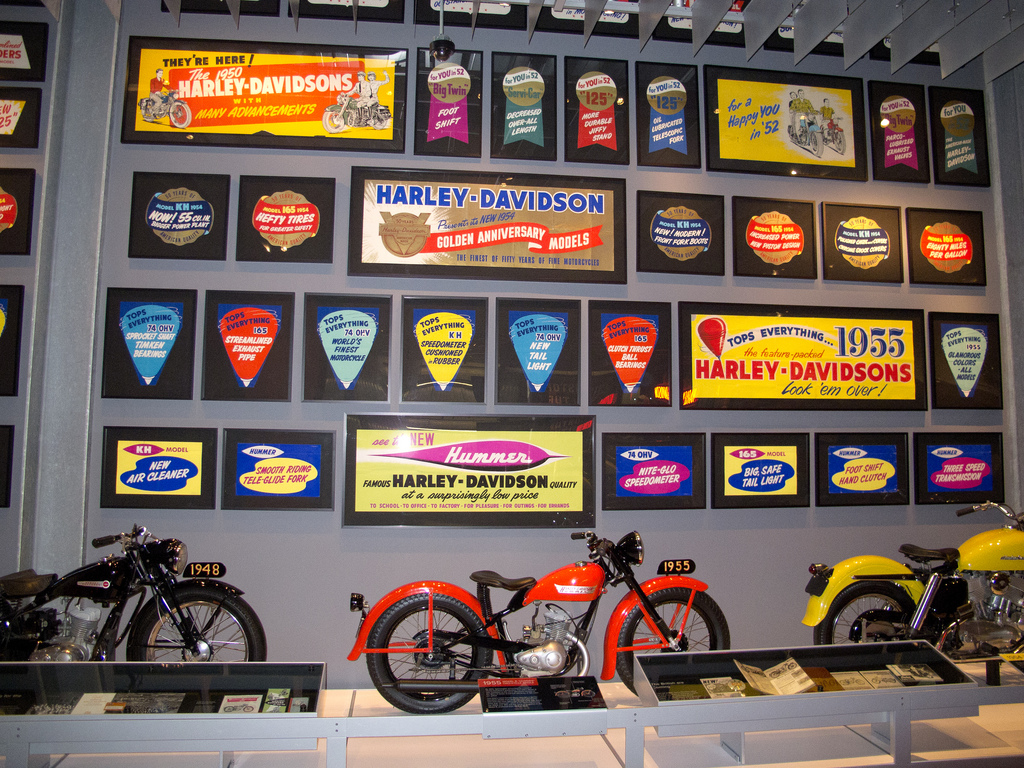
Above: An exhibit at the Harley Davidson Museum.

Oklahoma City TUG – Sonic & Devon Tower

Apr. 17, 2014

I did two different talks here: one at Sonic’s World HQ (they are a client) and another at the new and impressive Devon Tower (the giant skyscraper). In total, around 120 people attended these talks. The audiences were engaged and asked a lot of questions. Another InterWorks client, LifeChurch.tv, graciously gave a 10-minute demonstration of how they were using Tableau. I always get a thrill when a client catches the fever. Amber Smart is clearly a prototypical Tableau customer. She is very passionate about Tableau and is creating wonderful new insights for LifeChurch.

San Francisco TUG

Apr. 24, 2014

I was excited to be giving a talk in the epicenter of technology. Friends, clients, former InterWorks employees and data visualization fanatics (Tableau Zen Master, Chuck Hooper, again) added up to around 100 people crammed into a small space. That only made it seem like an even bigger crowd. This talk was a blast with lots of good questions and a very lively audience. People from Apple, Google, Facebook, Twitter and every other cool tech company in the Bay Area were there. You get the picture. Fun!

IW Crew

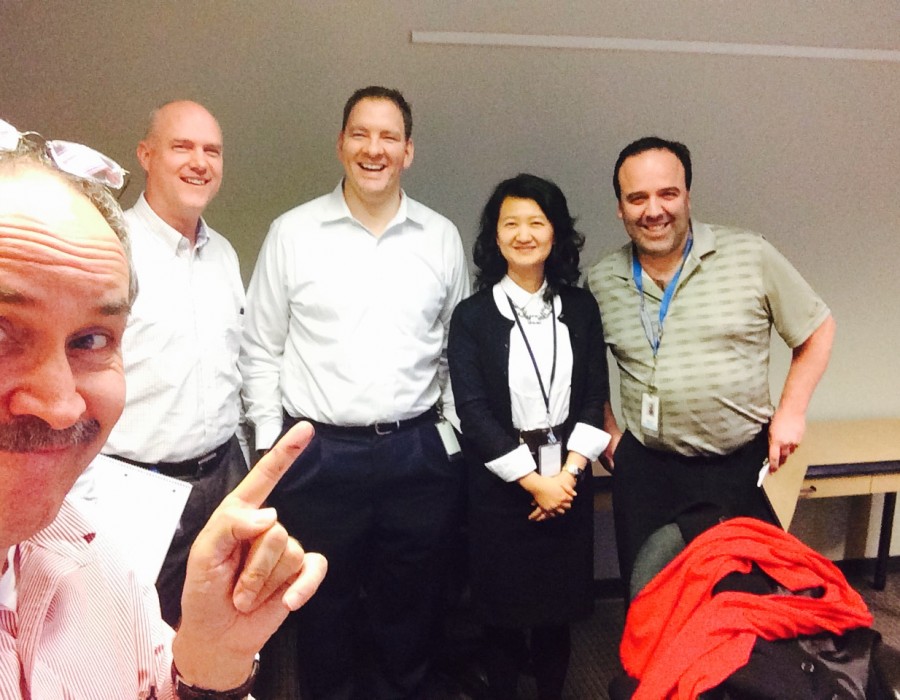
Above: Hanging out with current and former InterWorks employees in the Bay Area.

South Bay TUG – Netflix

May 1, 2014

The following week, I was back in San Francisco to give a talk at Netflix for the South Bay TUG. Netflix has a very cool speaking venue. Chuck Hooper officially became a “Tableau Your Data!” tour talk groupie by attending my roadshow for the third time. Tableau Zen Master and good friend, Andy Kriebel, was there along with gonzo Tableau Zen Master, Ryan Robitaille. Because I had some good friends in the audience, I decided to tell some stories about them and their cool breakthroughs with Tableau. This was the most active audience of the tour so far, and even larger and more well-known brand name companies were there asking questions. I actually got on a bit of an anti-cube rant with one of them in the hallway after my talk, which prevented me from seeing talks by Ryan and Andy. I also missed what sounded like a very funny talk by Tim Shea of DataSift. Afterwards, I had dinner with Chuck, Andy and Ryan, extending a data viz geek discussion for a couple more hours. Another thing about Tableau people – they are nice. Andy gave me a rather extended ride back to my hotel.

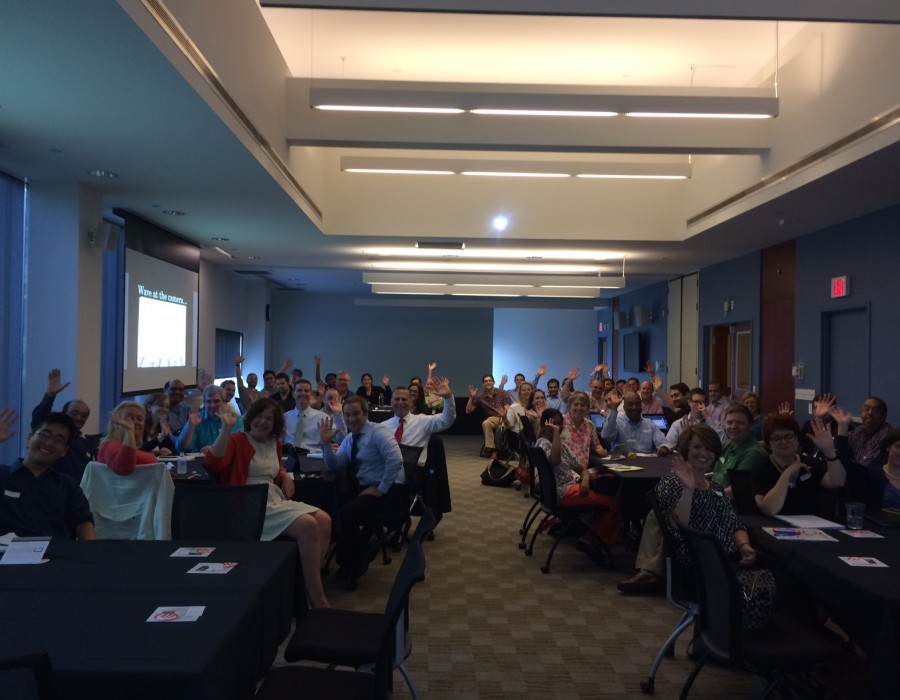
Chicago TUG – DePaul University

May 22, 2014 

I’d been looking forward to this speech for several weeks. A good friend and the winner of the first Tableau Data Visualization Contest, Rina Bongsu-Petersen, was my primary contact for the Chicago TUG. DePaul University hosted the speech in a very nice lecture hall. About 100 people came to the talk. The audience asked a lot of questions, and a dozen people stayed after the talk to ask more questions of me and Brian Bickell (who was in town and helpfully attending). I want to say a little more about Rina. I first met her after she won the contest with a visualization called “Fit and Fat in America.”

At the time, I wanted to write a blog post about Rina. I called her and interviewed her for about 90 minutes, intending to write a detailed piece about her and her contest-winning visualization. You can see the viz here. This was just around the point that our Tableau/BI practice at Tableau started to expand very rapidly. I went on the road for the next several years and never wrote the piece. So, Rina, this is my make-up for that shortcoming on my part.

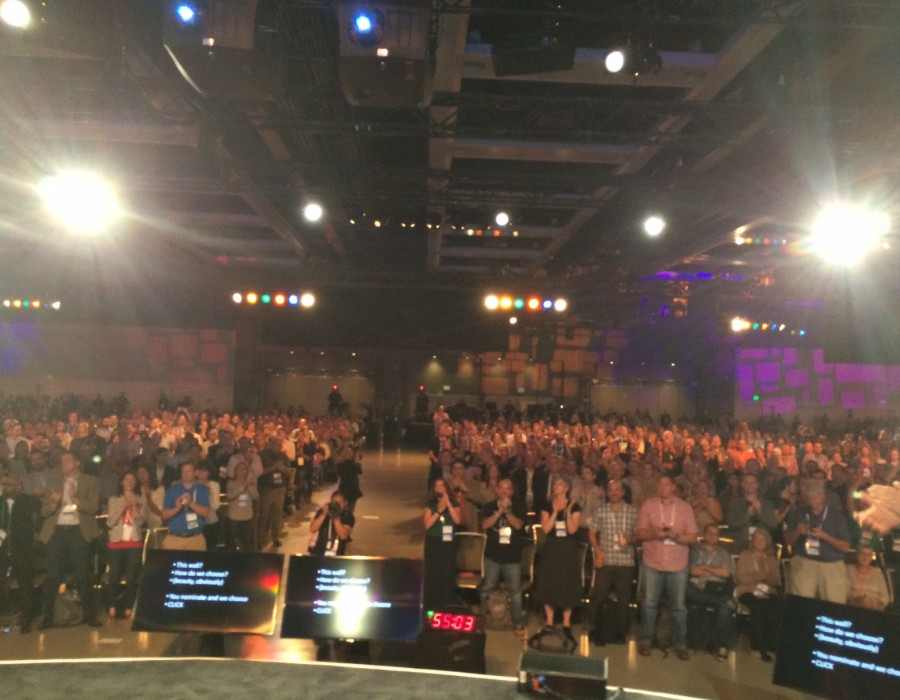
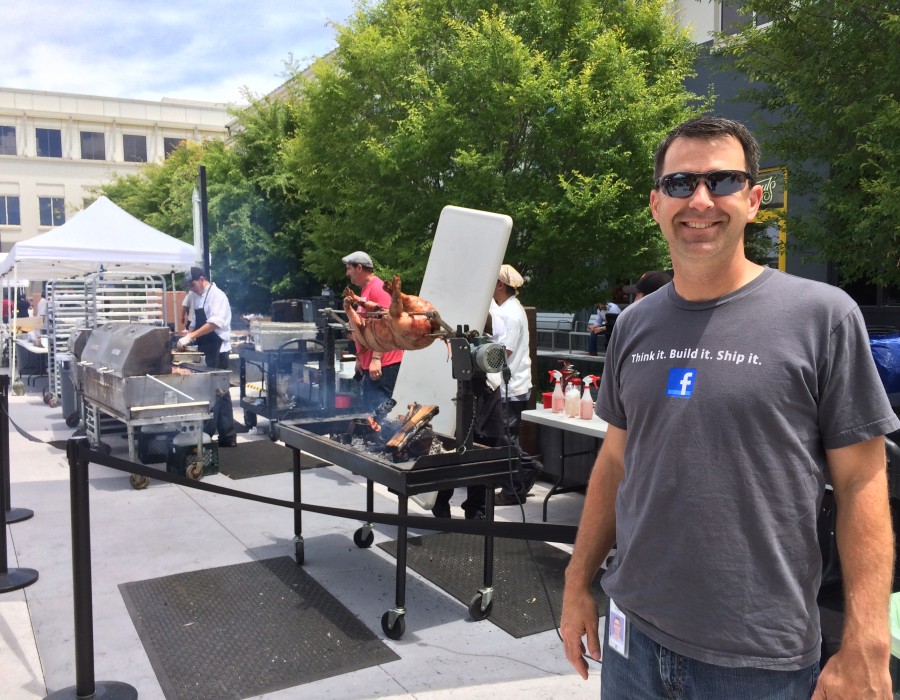
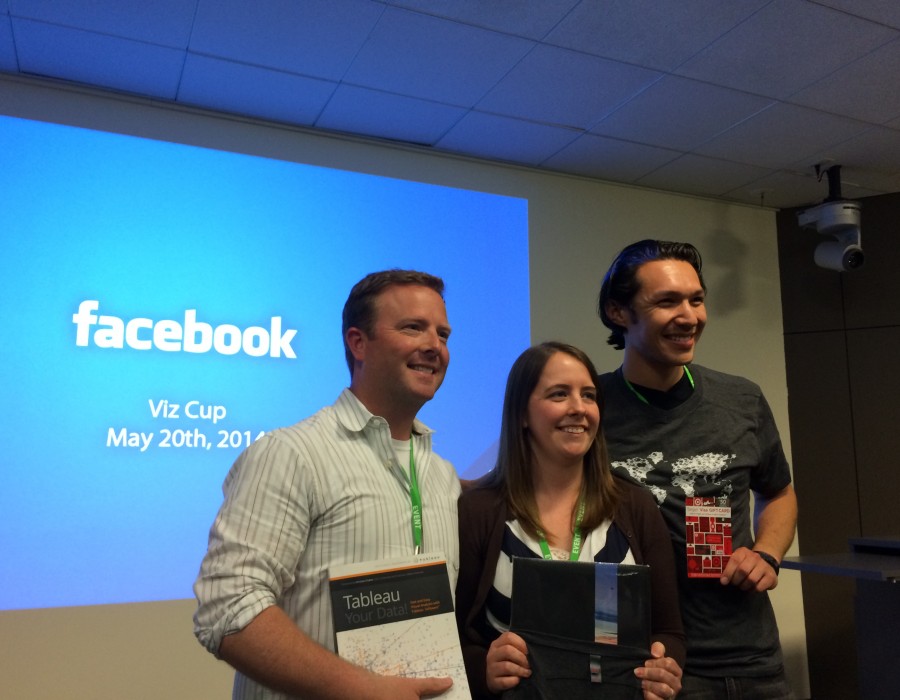
Facebook Talk & VizCup 2

May 20, 2014

Following Chicago, I did yet another speech at Facebook, but was also invited by Facebook to judge VizCup 2. Aside from the amazing pig-roast for 5,000 they were having that day, the contest brought together data visualizers from all over the Bay Area. For a detailed review of that session, see this post. The winners used a beta release of Tableau 8.2. They utilized the new Story Points feature to deliver findings of their 60-minute data dive in 60 seconds. This is where the Story Points feature really shined. Three people presented twelve story points in 60 seconds. They clearly and convincingly made their findings understood. Very cool.

Viz Cup 2

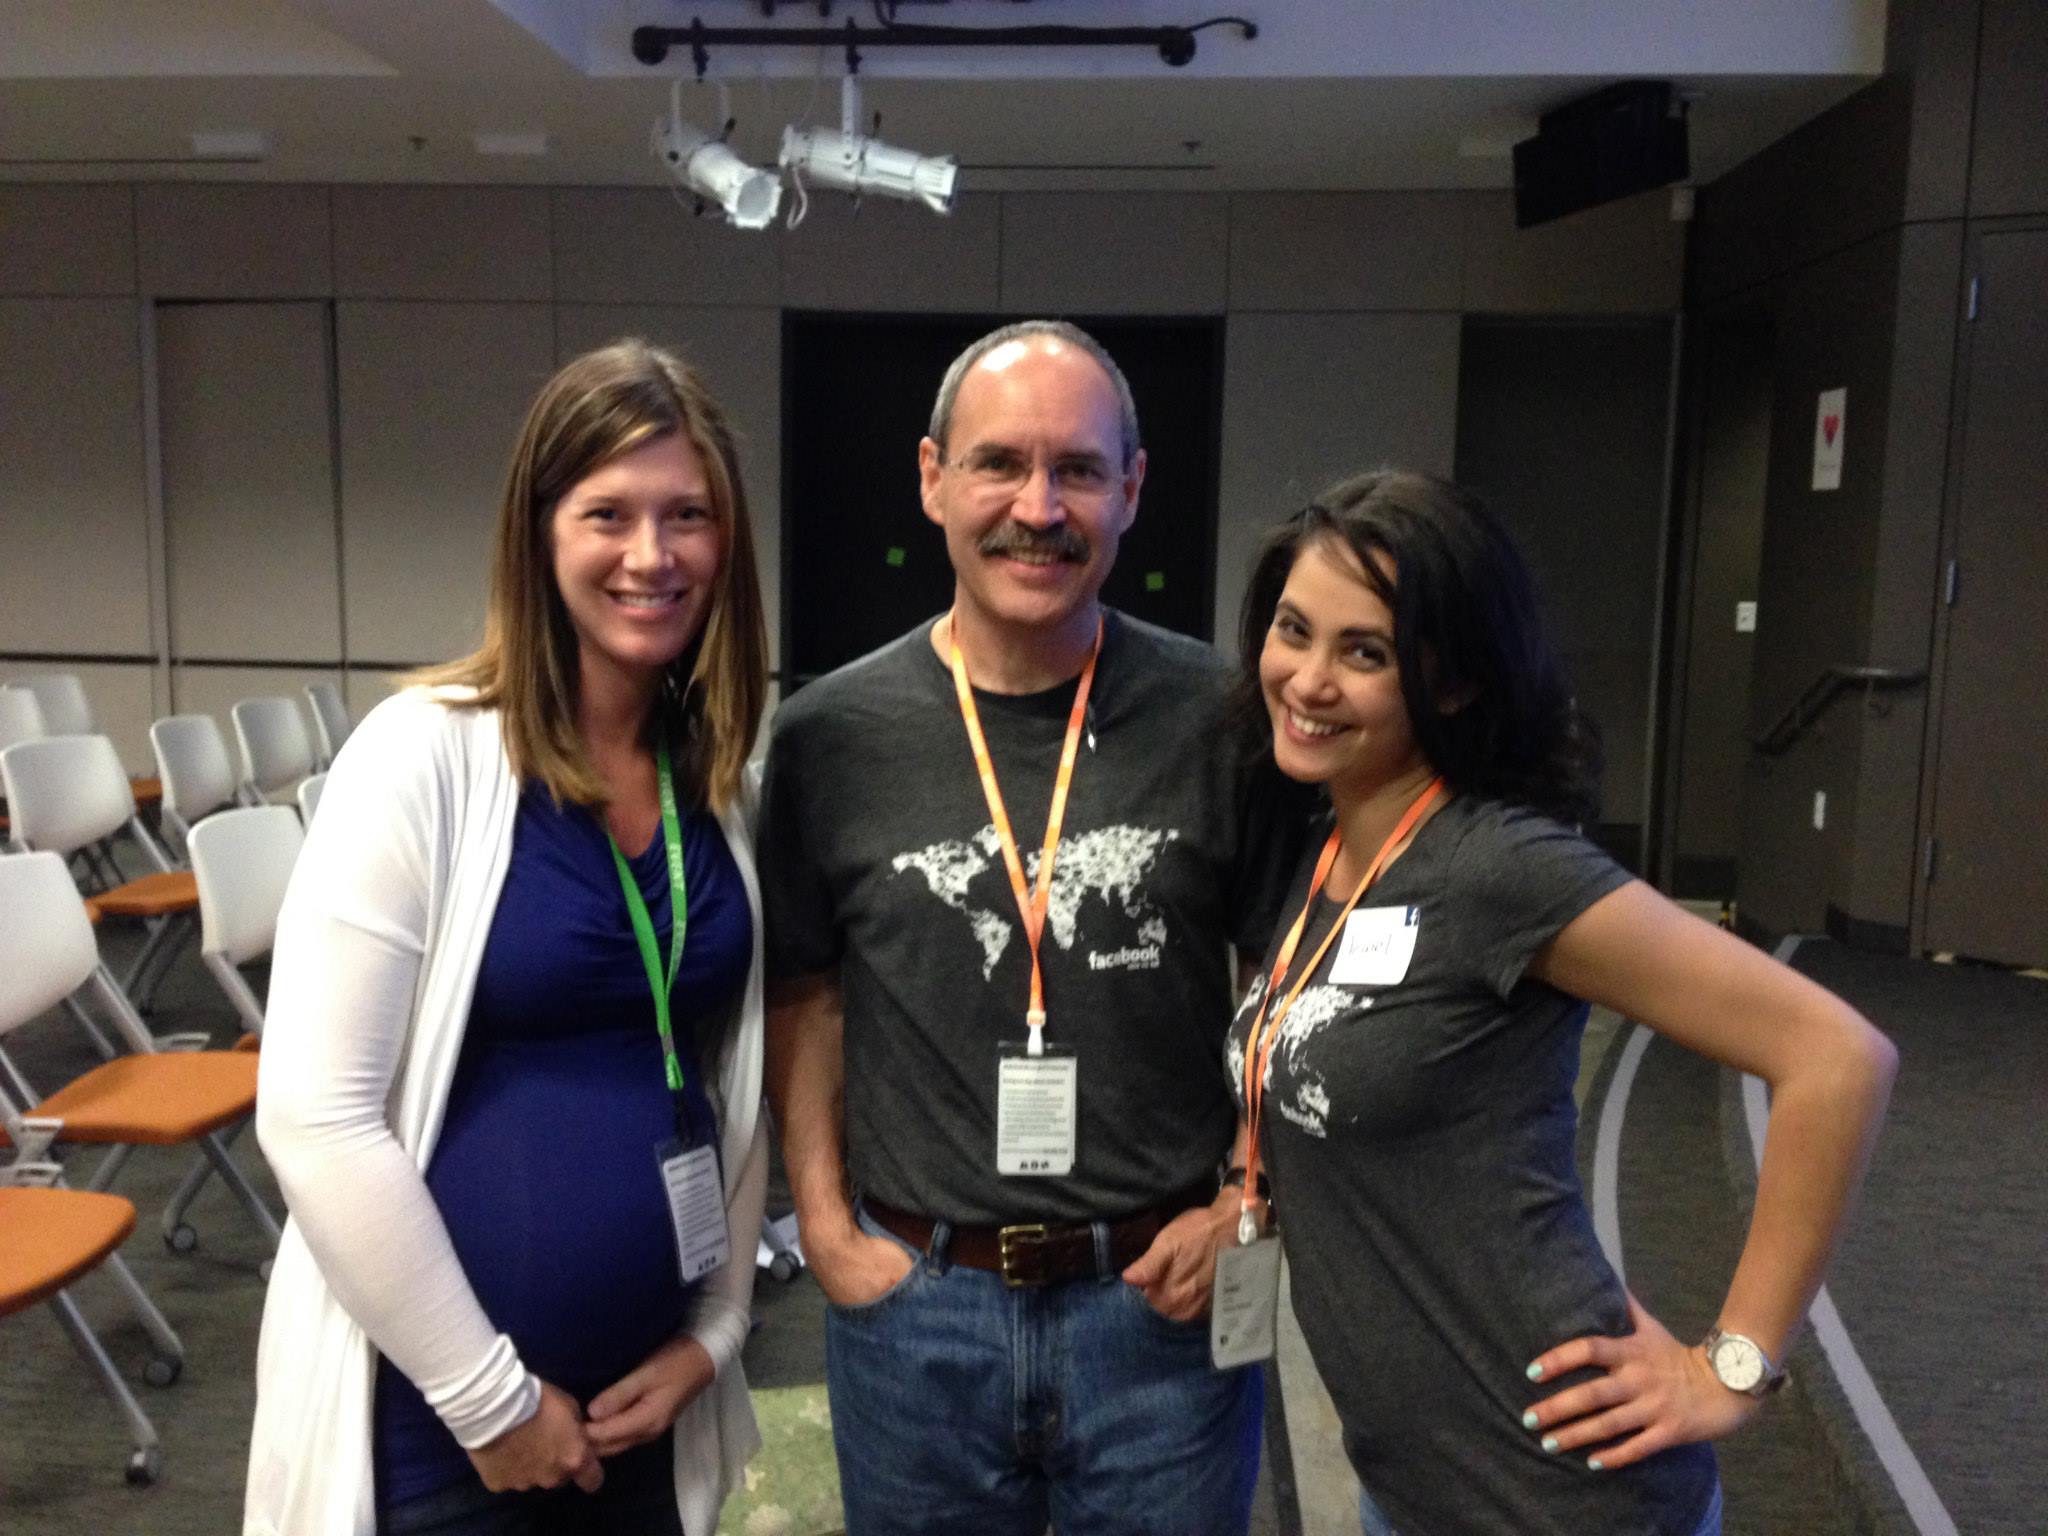
Above: Myself and fellow Viz Wars 2 judges, Cole Nussbaumer (left) and Jewel Loree (right).

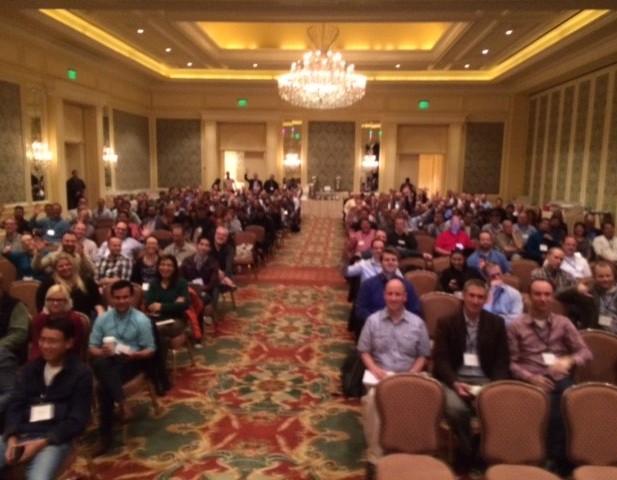
Seattle TUG – Washington Athletic Club

June 19, 2014

It was wonderful to visit Seattle. Earlier in the week, I attended the Alteryx Inspire Conference in San Diego. During my Seattle trip, I visited Tableau HQ and caught up with some good friends at Tableau Software. Slalom Consulting sponsored my talk, and I have to say, was EXTREMELY patient with me following my surgery. I had to cancel and reschedule four talks. The Seattle talk was rescheduled twice. So, I have to thank Slalom for putting-up with my volatile schedule. It was worth it. Around 120 people attended (over 200 signed-up), and the after-meeting discussion with the attendees was really great. I made several new Tableau friends, including Slalom’s BI practice lead in Seattle, Craig Wake. Thank you, Craig, for arranging the quality venue!
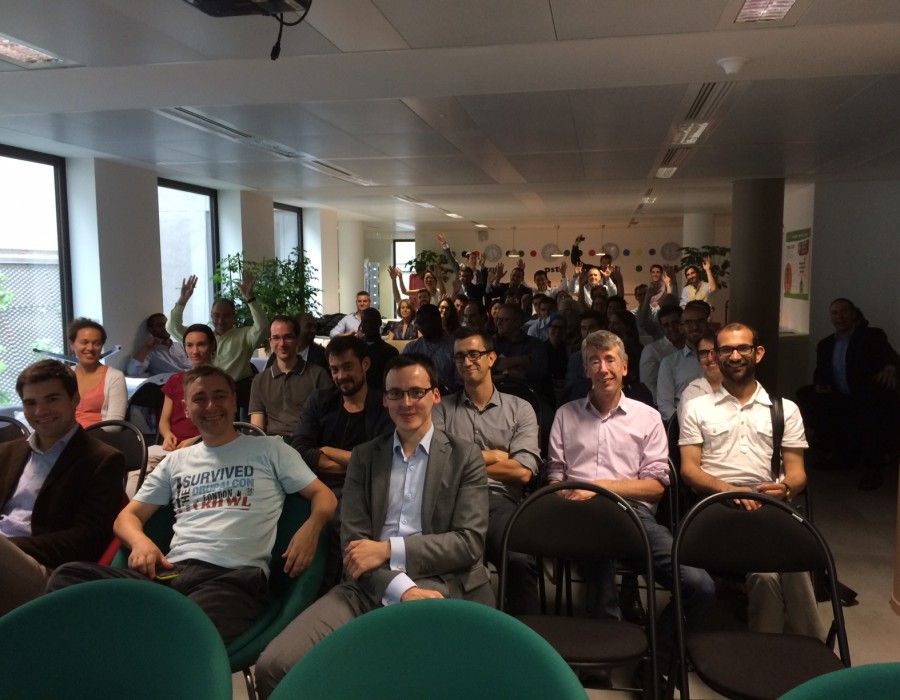
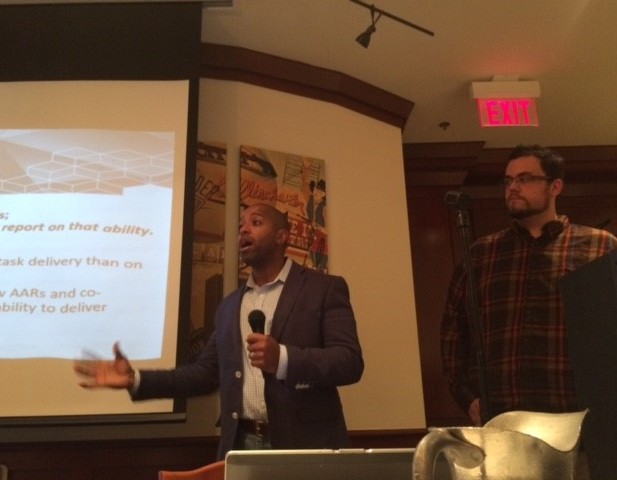
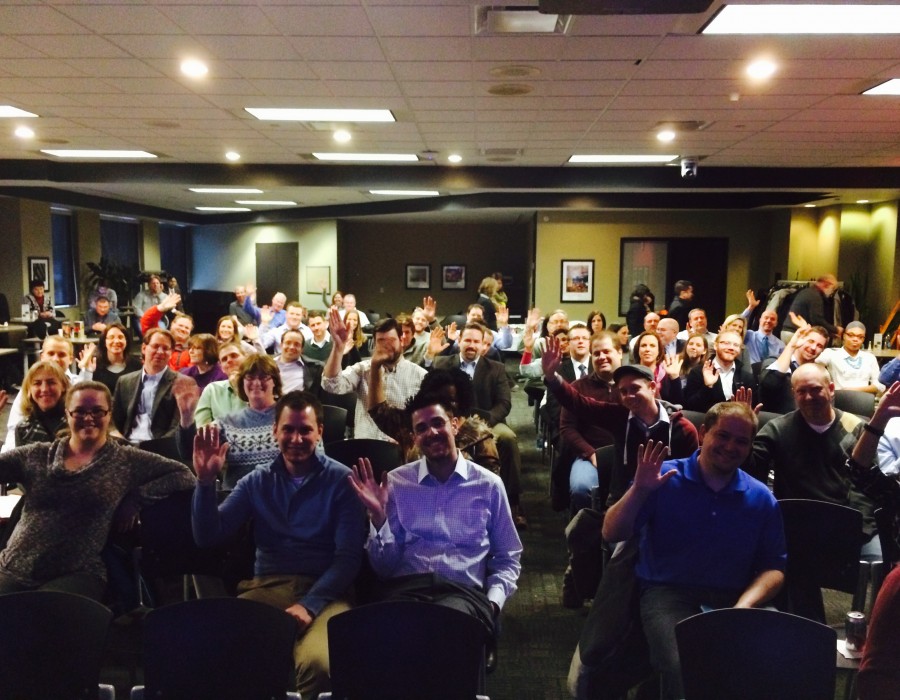
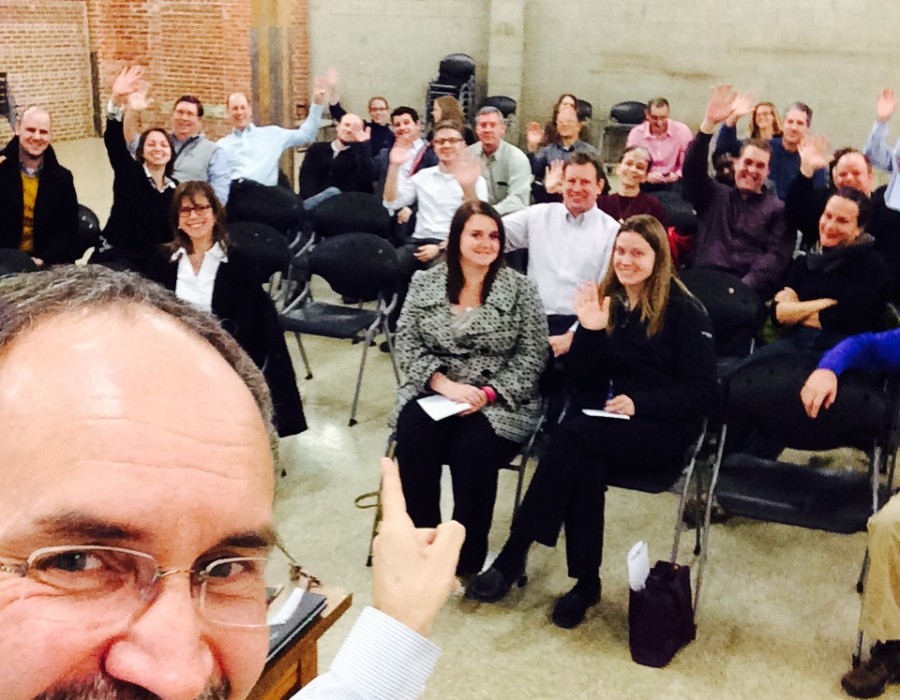
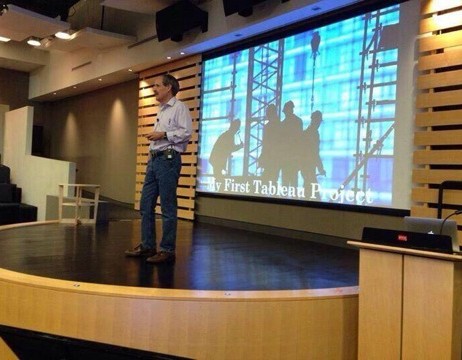
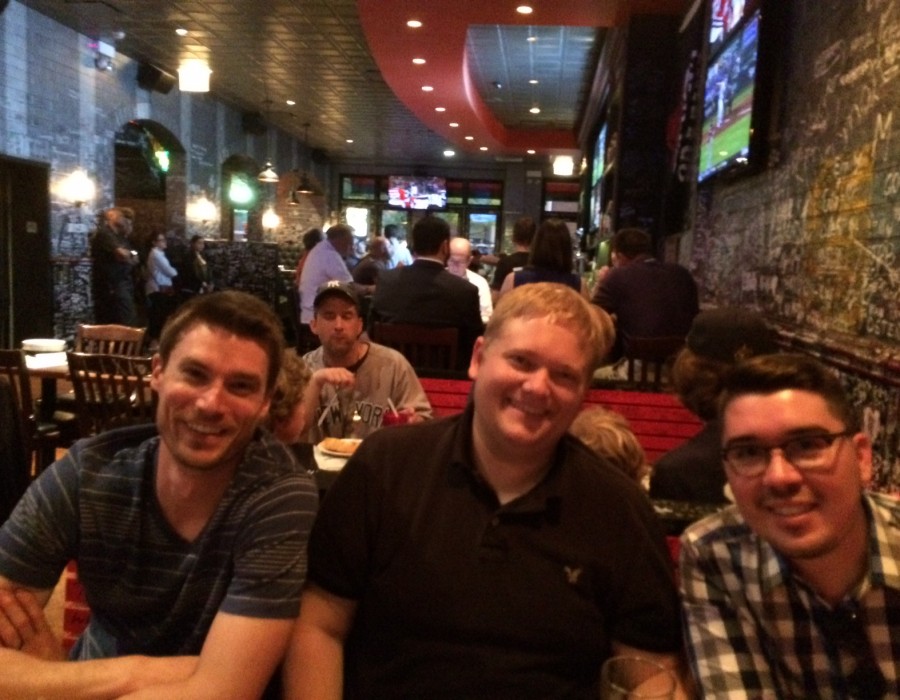
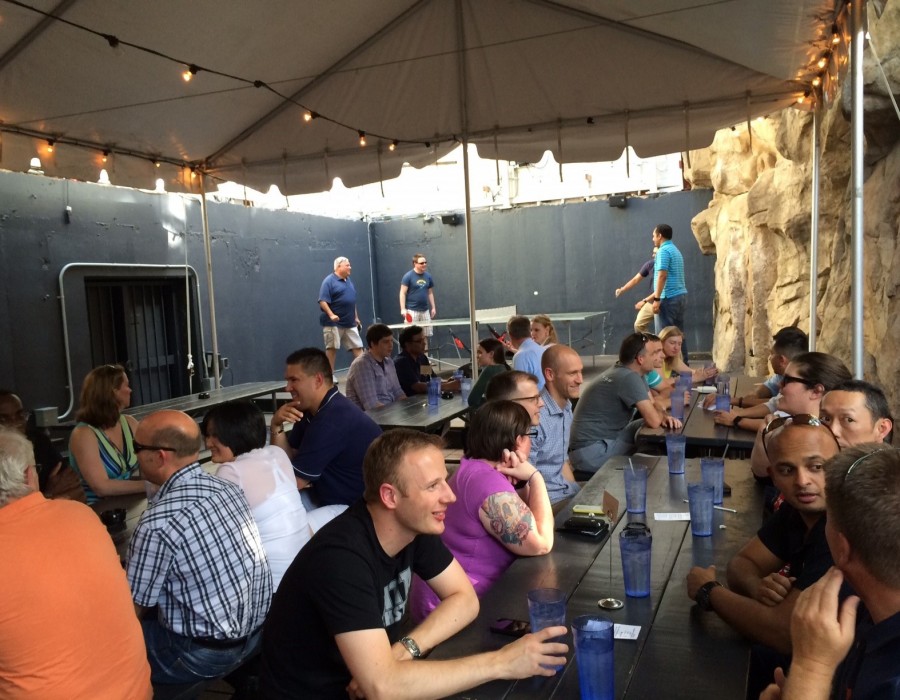
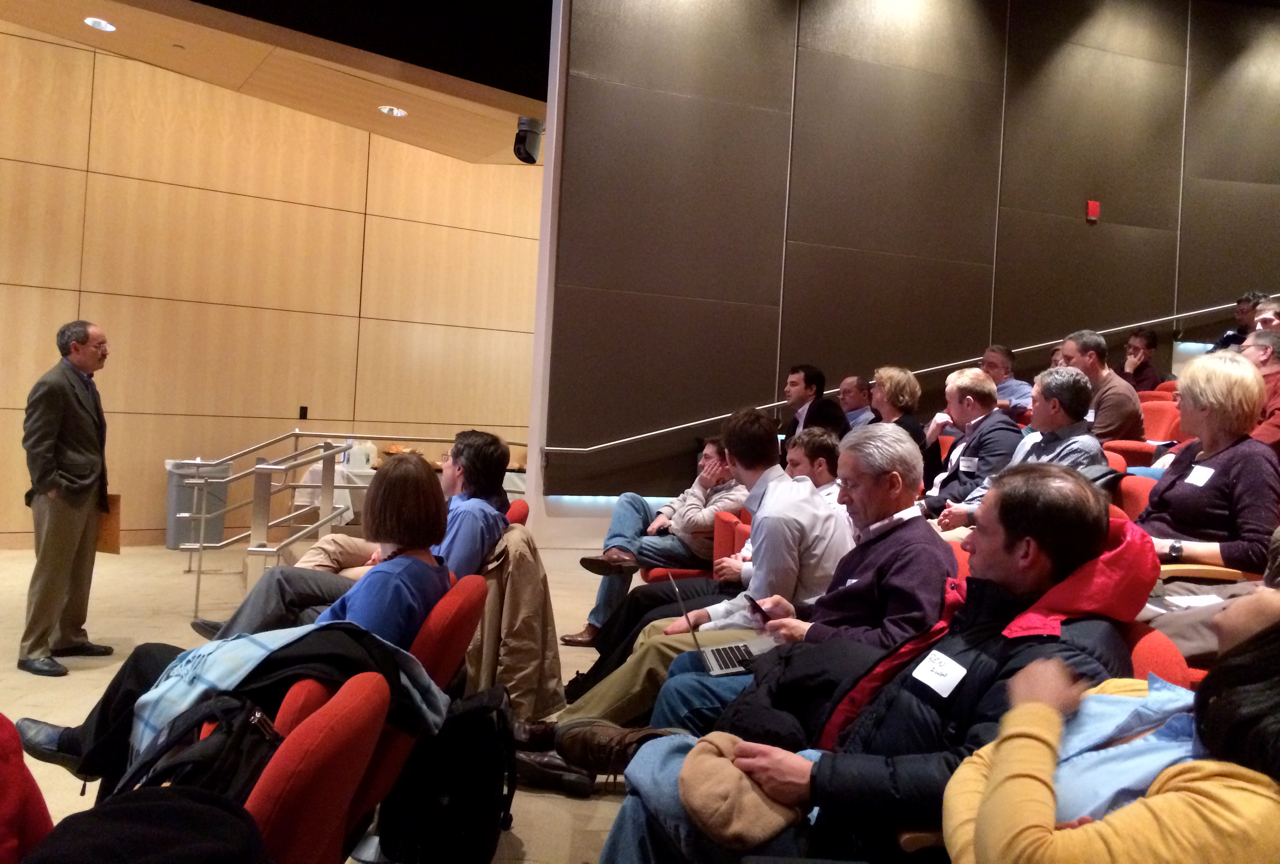
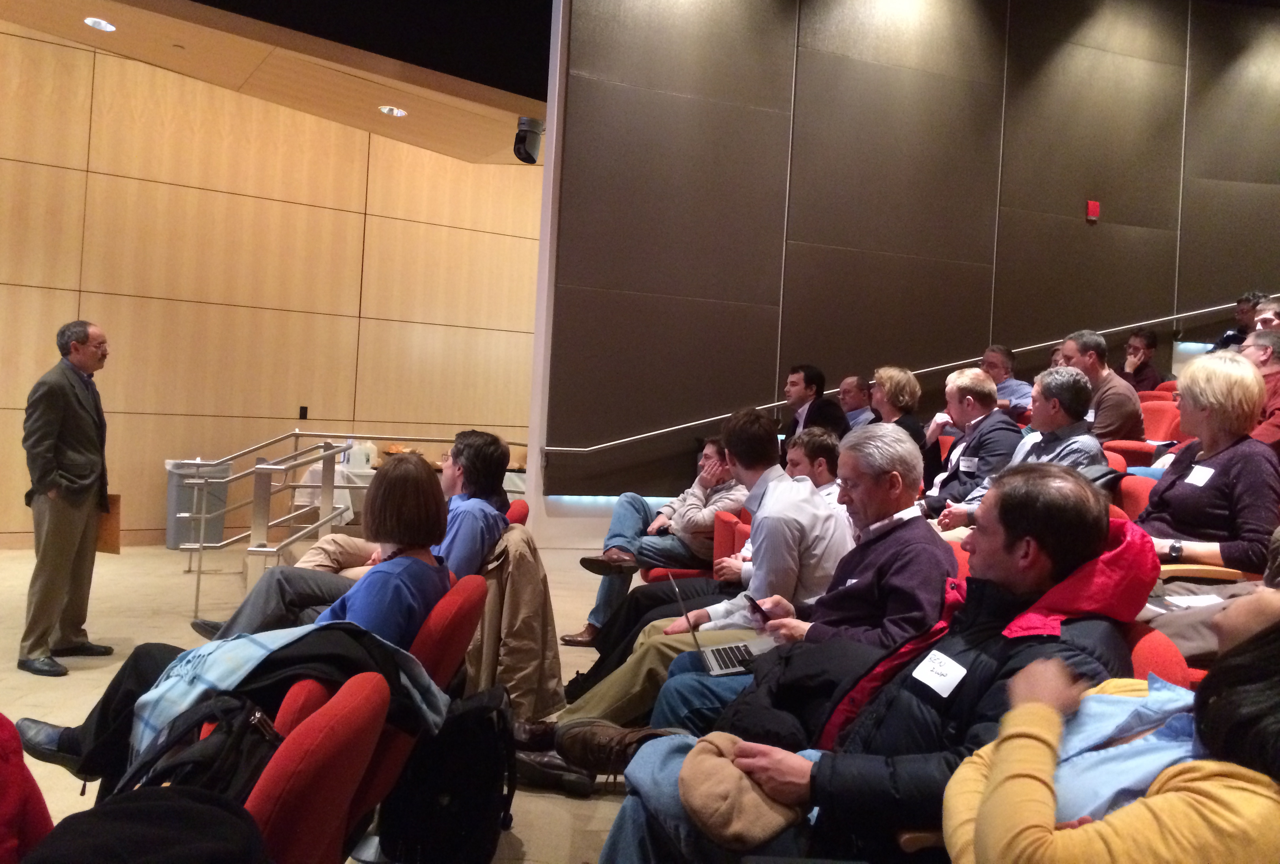
Pittsburgh TUG

June 24, 2014

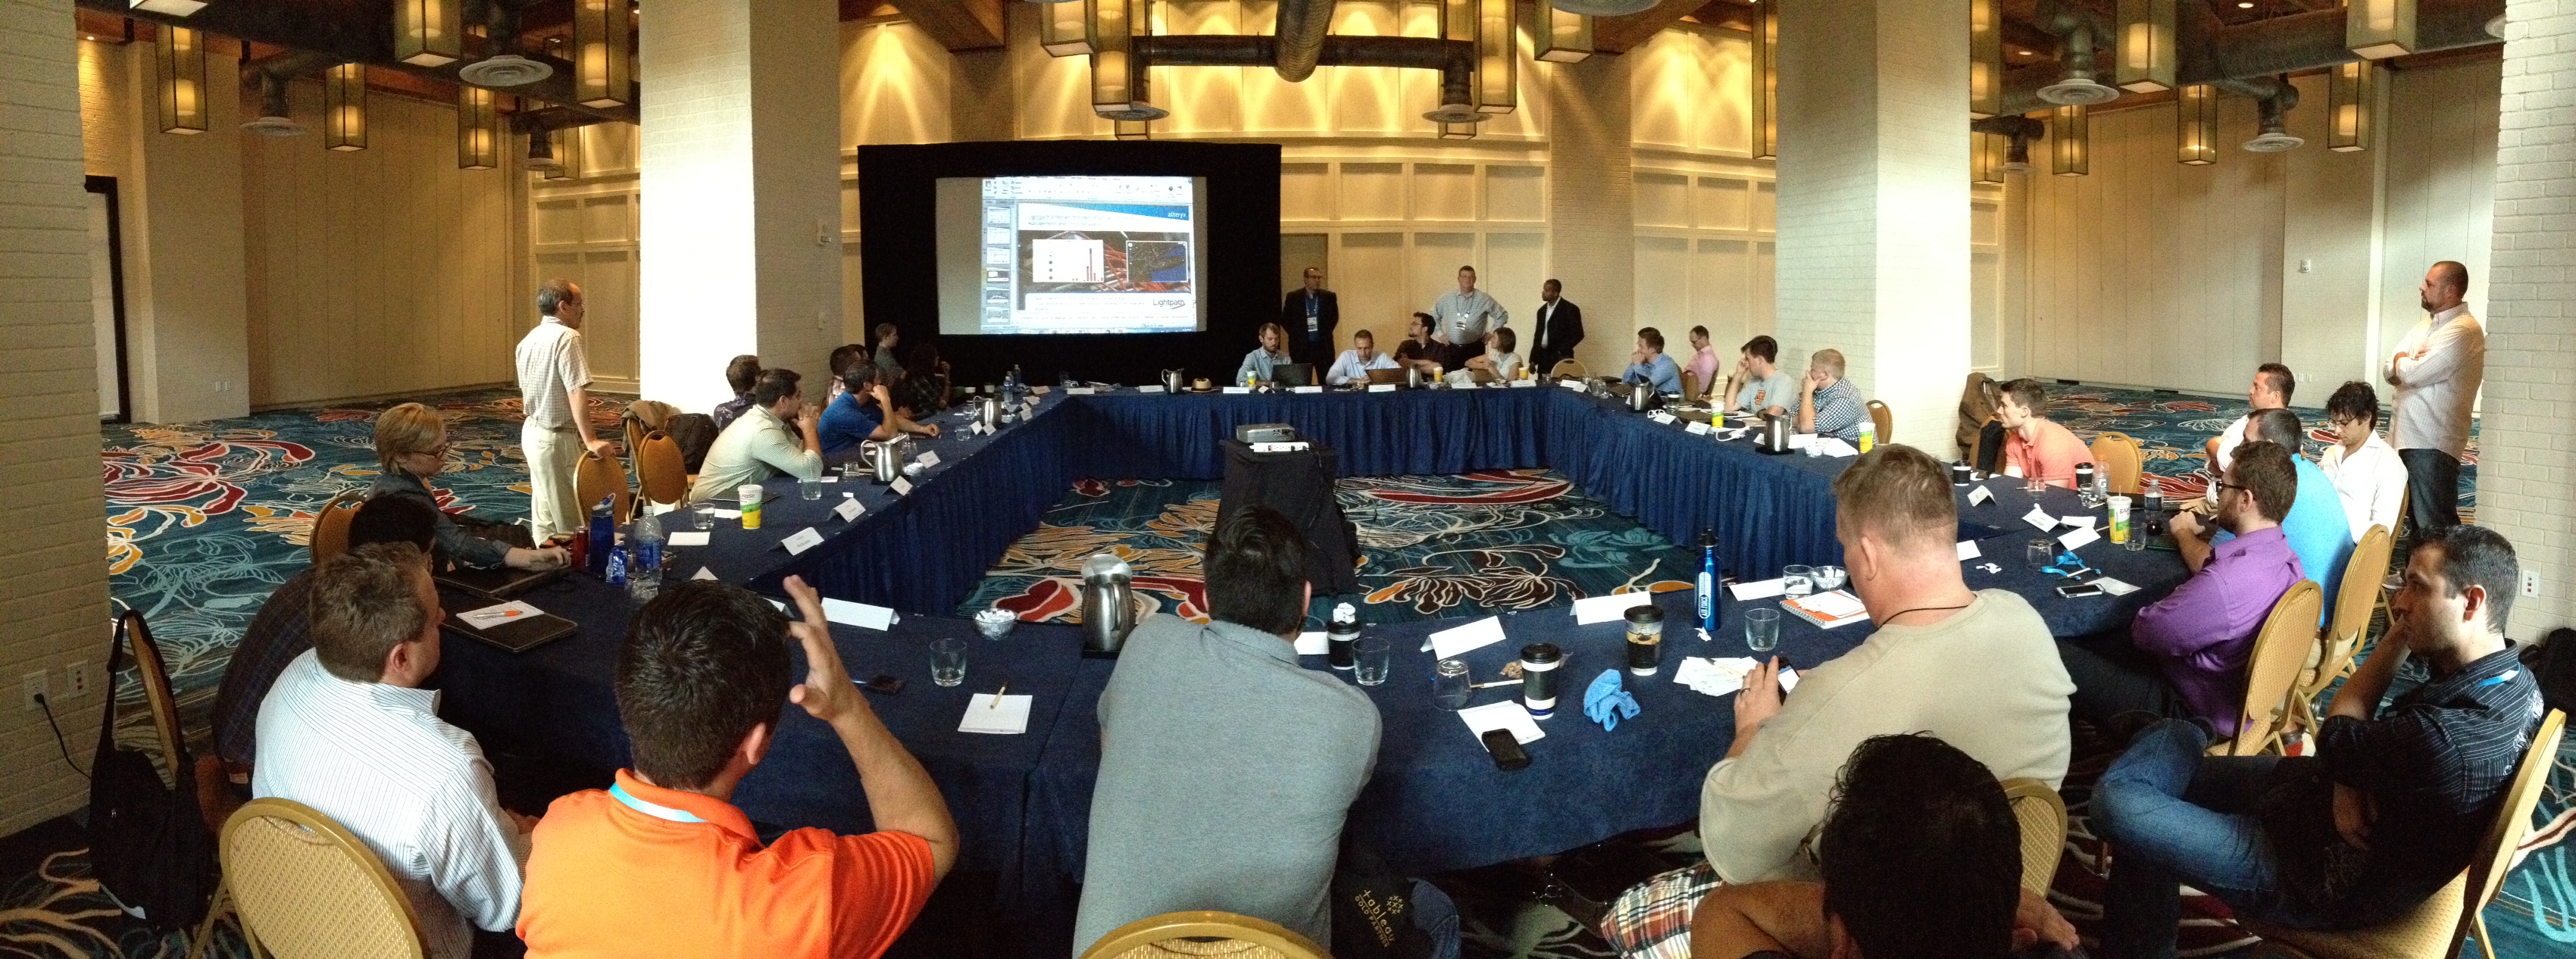
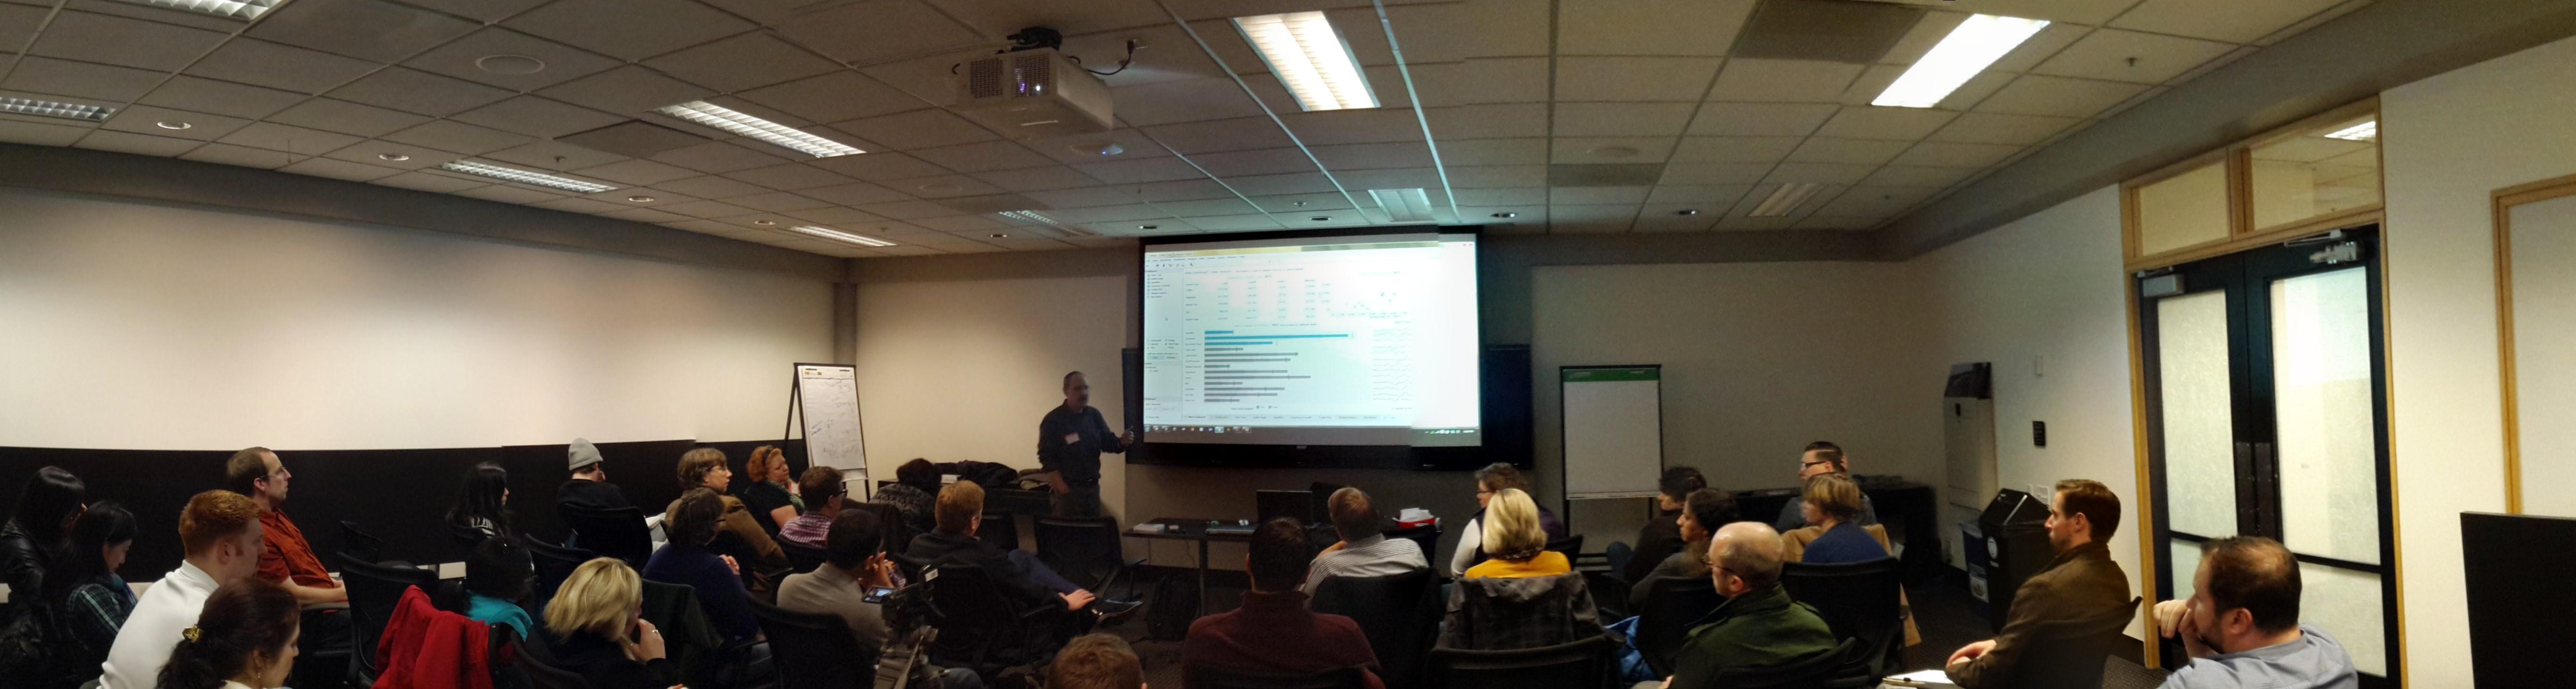
Last, but not least, was my talk at Carnegie Mellon University. This was another speech that was rescheduled with little notice due to my surgery. Ted Curran and Jill Wooster of CMU did a great job rescheduling the event. Around 80 people attended, and the whole event covered three hours. There was one hour of speaking along with two hours of Q&A, especially on the topics of data governance, security and scaling servers to large deployments.

Pittsburgh TUG

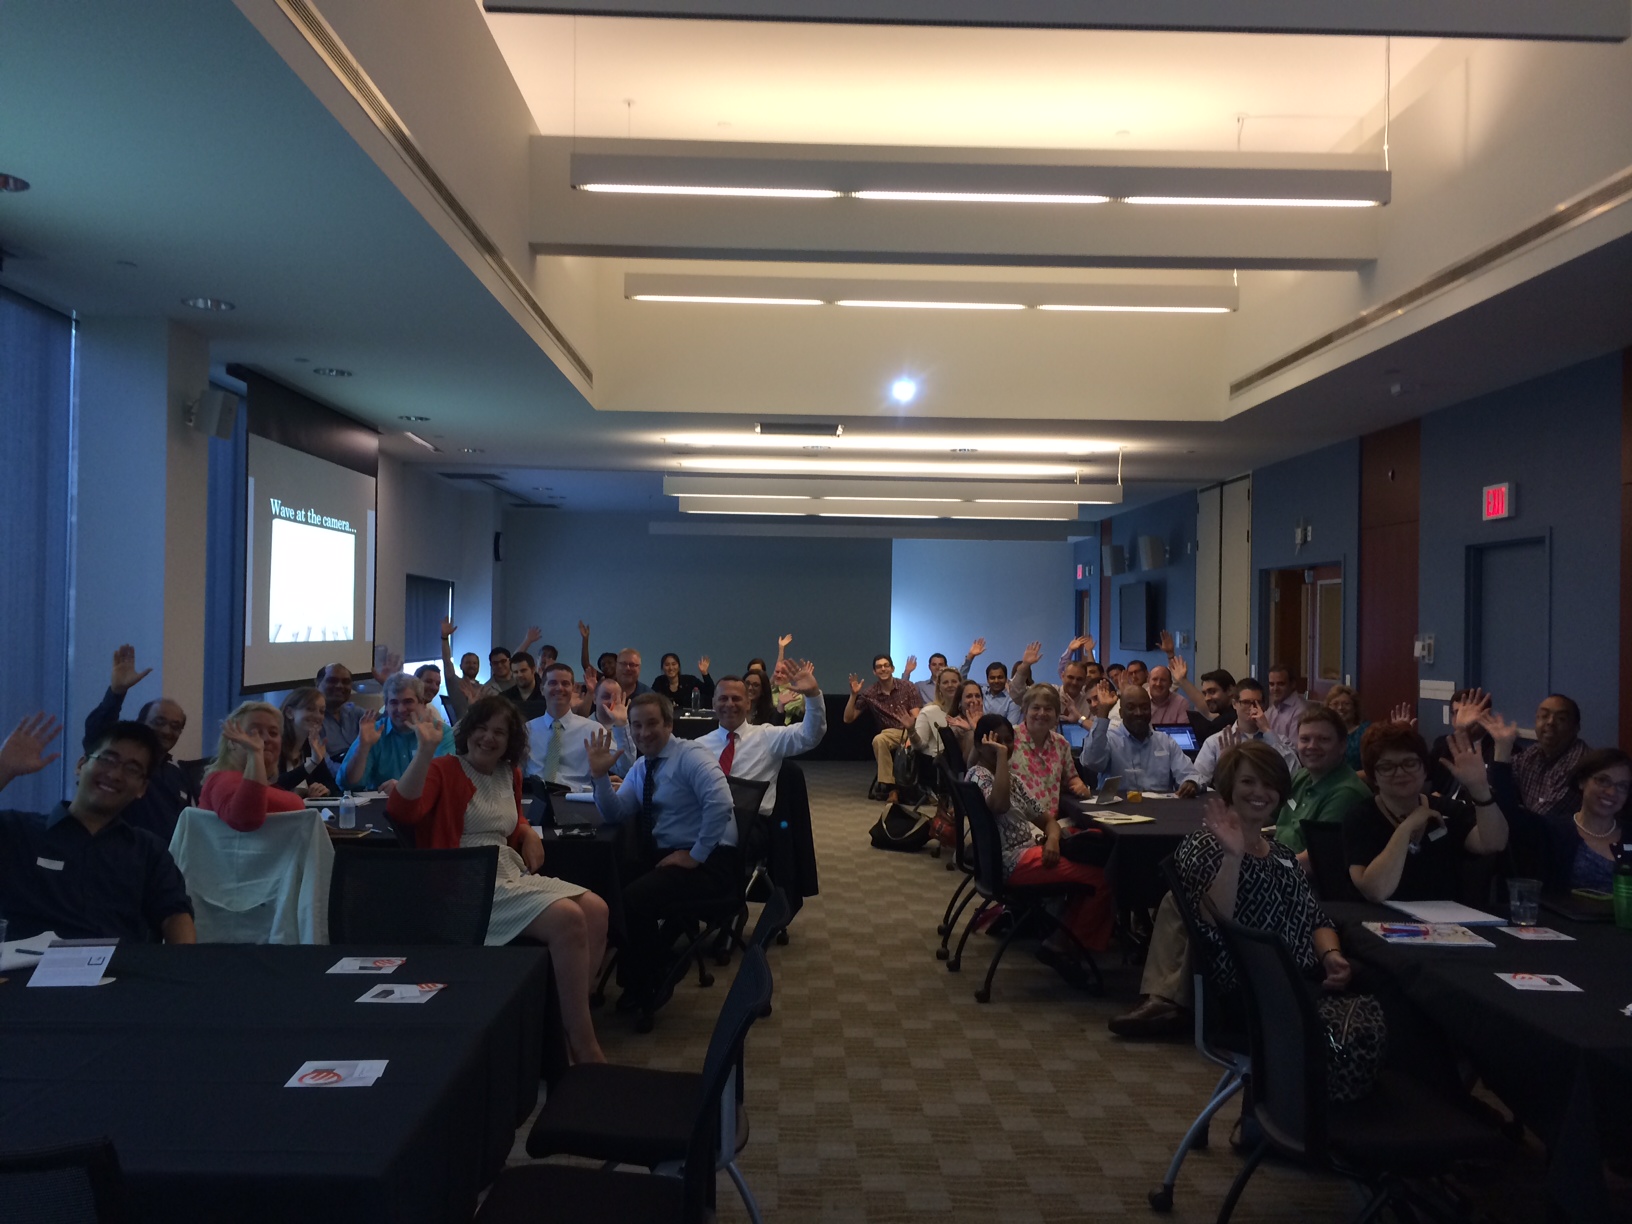
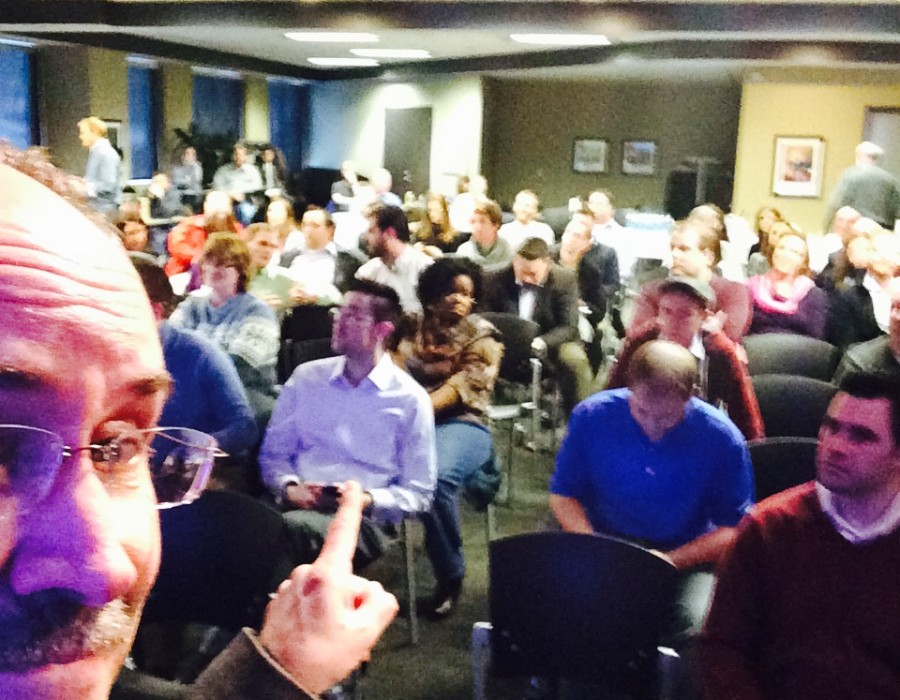
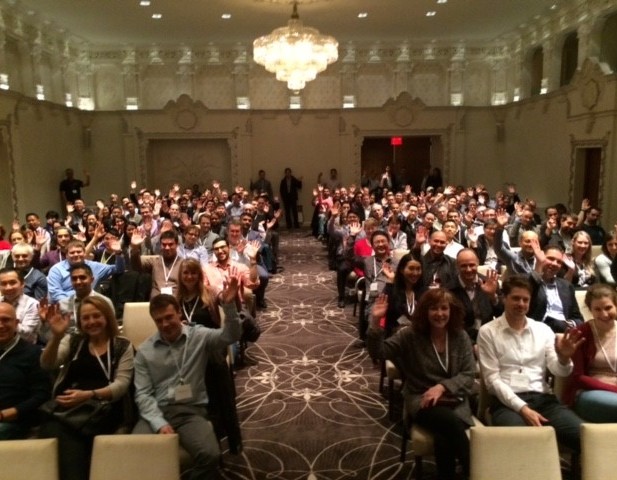
Above: A crowd shot of the Pittsburgh TUG at CMU.

Upcoming Events

The book tour is now moving to Europe. Be sure to check out the full list of dates and locations. I’ll be doing a talk with Zen Master, Andy Kriebel, of Facebook about how to start and run an effective Tableau user group. Andy and I started the first user group in the United States a long time ago when he was still in Atlanta at Coca-Cola. John Hoover/Andy Piper (Norfolk Southern) and Chris Cushman/Martin Click (then of UPS) were also co-founders.

Upon returning from Europe, I’ll finish the book tour talks at my favorite user group in August – the Atlanta Tableau User Group.

Thanks for a wonderful tour, America!

Hey Europe – I Grok Your Munge, Visually!

Posted - Jul 1st, 2014
Facebooktwittergoogle_pluspinterestlinkedinmailFacebooktwittergoogle_pluspinterestlinkedinmail
  • “Tableau Your Data!” author, Dan Murray looks ahead to his European book tour …
Bay Area TUGAbove: Speaking at the Bay Area TUG.

I’m looking forward to my upcoming European speaking tour that kicks-off with a talk at the Tableau Conference on Tour in London with Andy Kriebel (Facebook’s resident Tableau Zen Master). I immediately follow that talk with a “Tableau Your Data!” tour speech at the London TUG with François Ajenstat of Tableau Software. Then, it’s on to the rest of Europe.

What’s the goal of the European “Tableau Your Data!” tour? To grok your munge, of course. You may be scratching your head a bit at my choice of words. I promise that this isn’t some ill attempt at me speaking Dutch. Let me explain.

For those of you that don’t already know how to “grok” and “munge,” you can find definitions of the cultural references on Wikipedia, the free encyclopedia.

“Grok” /ˈɡrɒk/ is a word coined by Robert A. Heinlein for his 1961 science-fiction novel, “Stranger in a Strange Land,” where it is defined as follows:

“Grok means to understand so thoroughly that the observer becomes a part of the observed—to merge, blend, intermarry, lose identity in group experience. It means almost everything that we mean by religion, philosophy, and science—and it means as little to us (because of our Earthling assumptions) as color means to a blind man.”

“Mung” or “munge” is computer jargon for a series of changes to a piece of data, which are often well-defined and individually reversible, but which transform the original item into an unrecognizable form. The changes may be destructive, e.g. by corrupting a computer file, or simply concealing, e.g. changes to an email address to disguise it from spambots).

The term was coined in 1958 in the Tech Model Railroad Club at the Massachusetts Institute of Technology. In 1960, the backronym “Mash Until No Good” was created to describe Mung, and a while after it was revised to “Mung Until No Good,” making it one of the first recursive acronyms. It lived on as a recursive command in the editing language, TECO.

I highly recommend chanting “I grok your munge” while playing “Ramble On” by Led Zepplin. Check it out on Spotify. I also highly recommend coming out to my European book tour. Check out details and dates.