TYD2 Tour Journal: Milwaukee

Posted - Feb 26th, 2016
Facebooktwittergoogle_pluspinterestlinkedinmailFacebooktwittergoogle_pluspinterestlinkedinmail

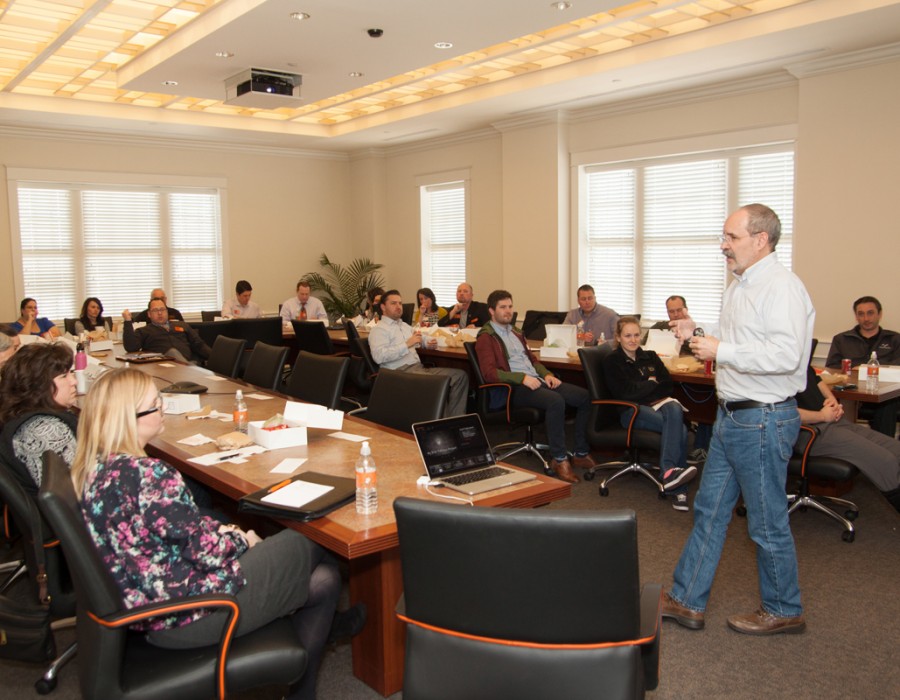
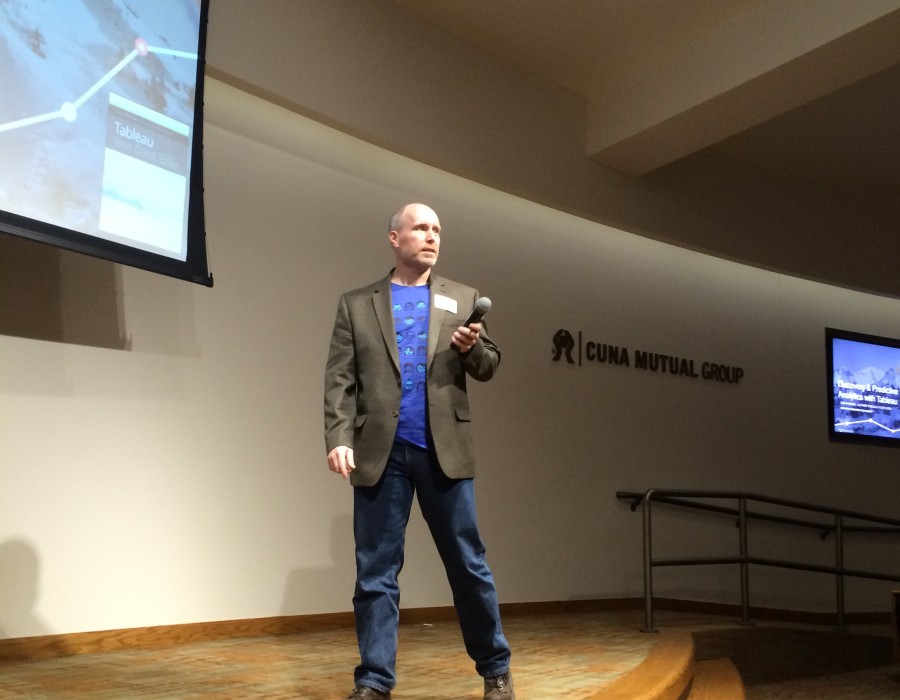
This is the fourth time that I’ve gone to Milwaukee in the last few years to give a talk at the local TUG, speak at a Tableau Data Driven event or judge a Viz War contest. Each visit has been fun and engaging.

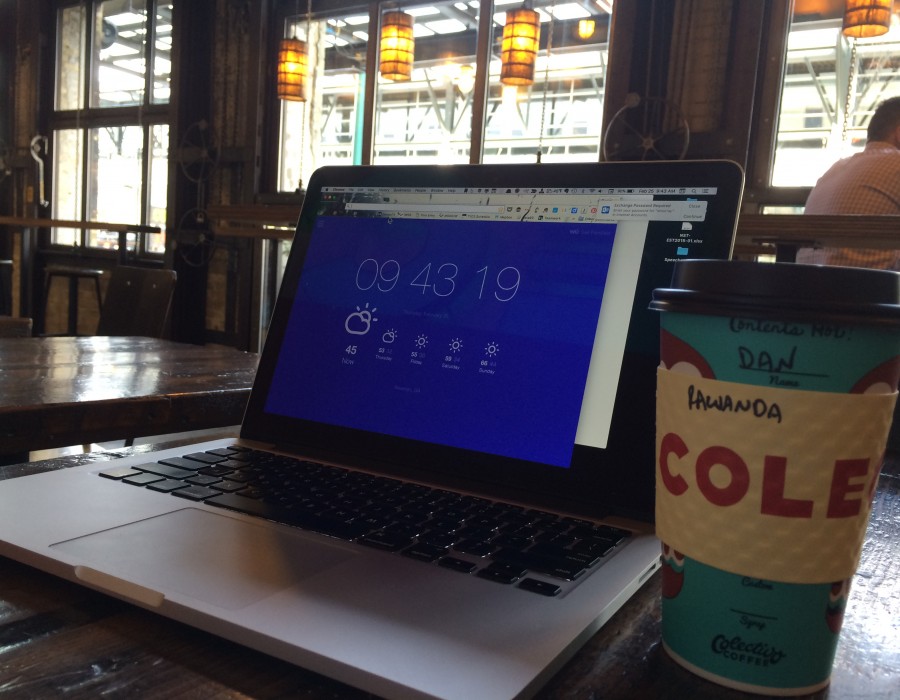
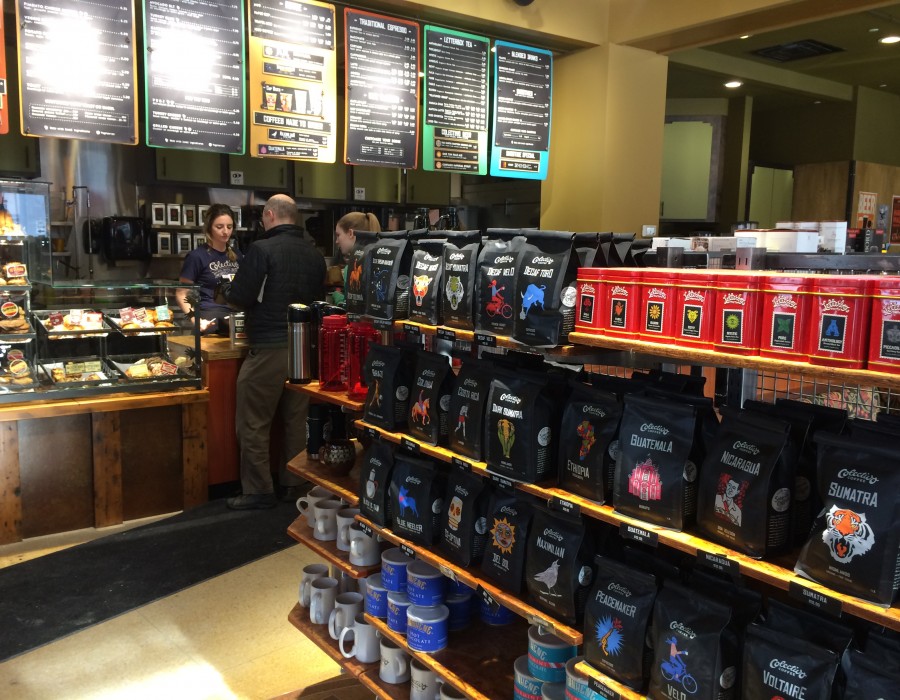
Leaving home around 6 a.m. for the airport, I arrived in Milwaukee plenty early. I decided to stop for some coffee at Colectivo Coffee in the Third Ward to review my files. I got a great cup of Rwanda single-origin pour-over that was excellent. If you’re in Milwaukee, you should definitely stop in one of Colectivo’s locations. They aren’t paying me to say that — I just like the vibe of their locations and their coffee.

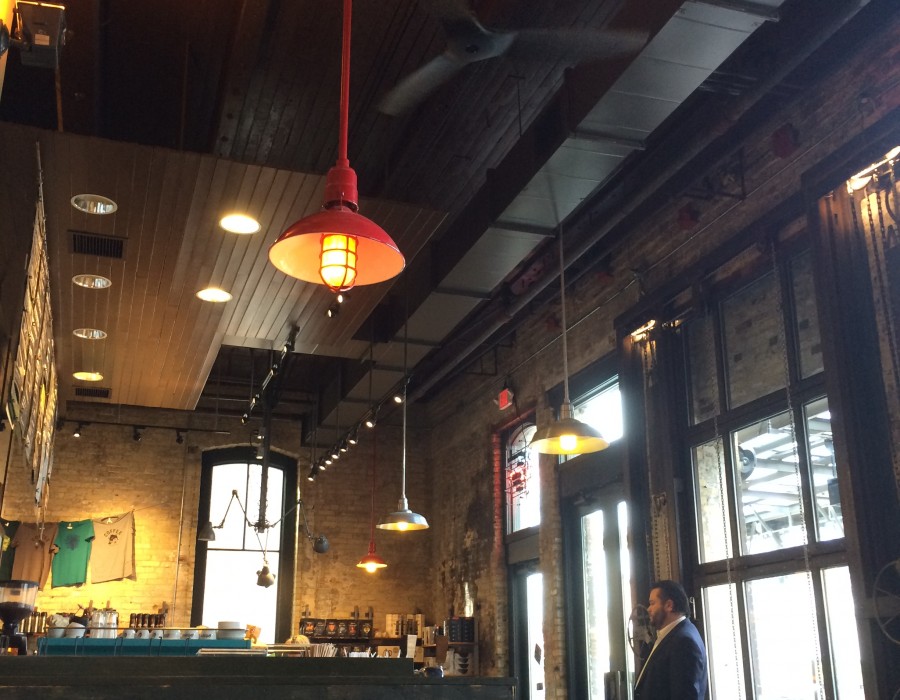
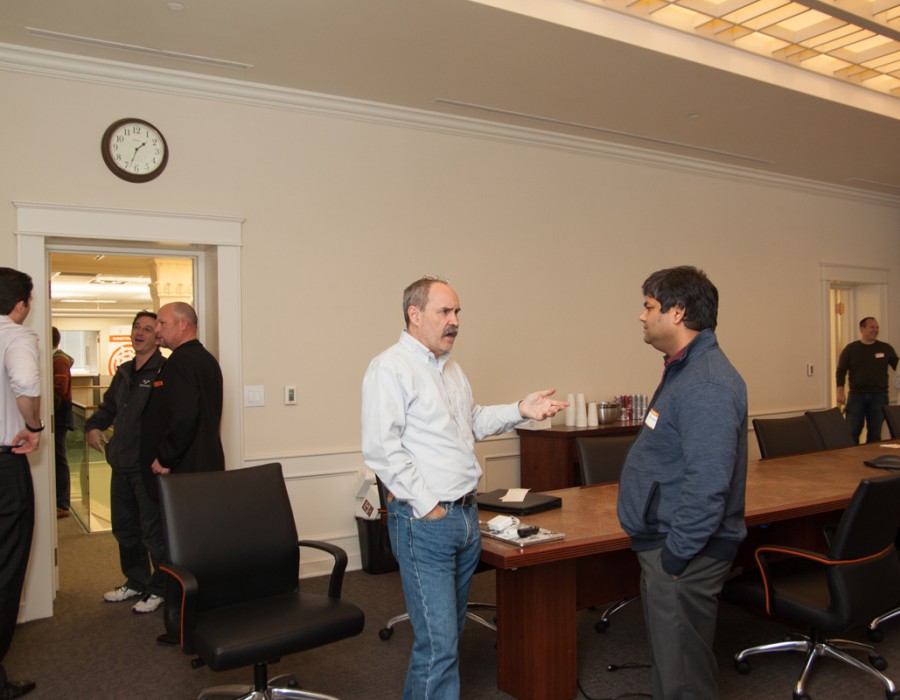
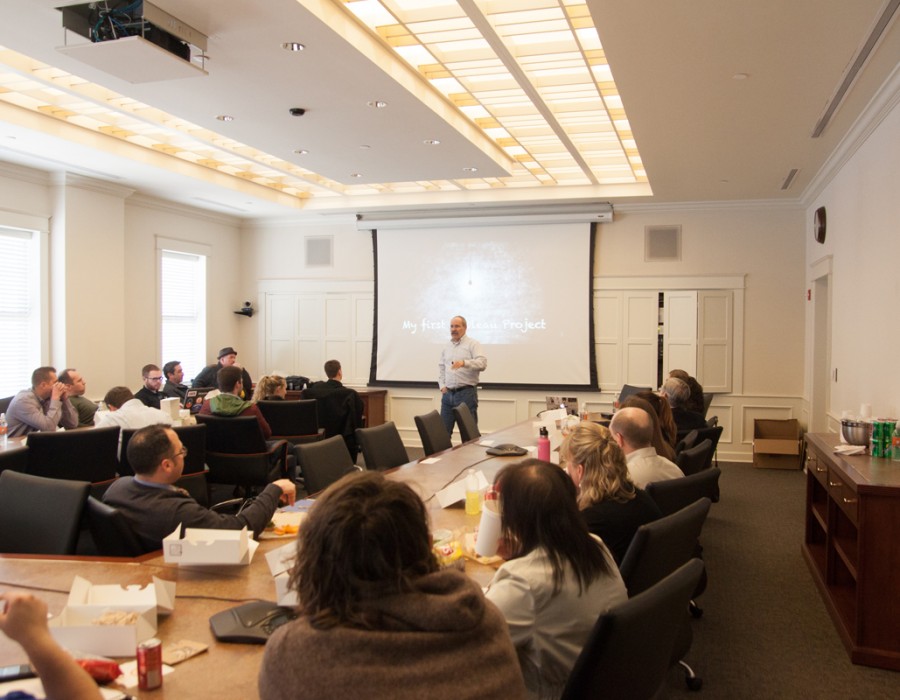
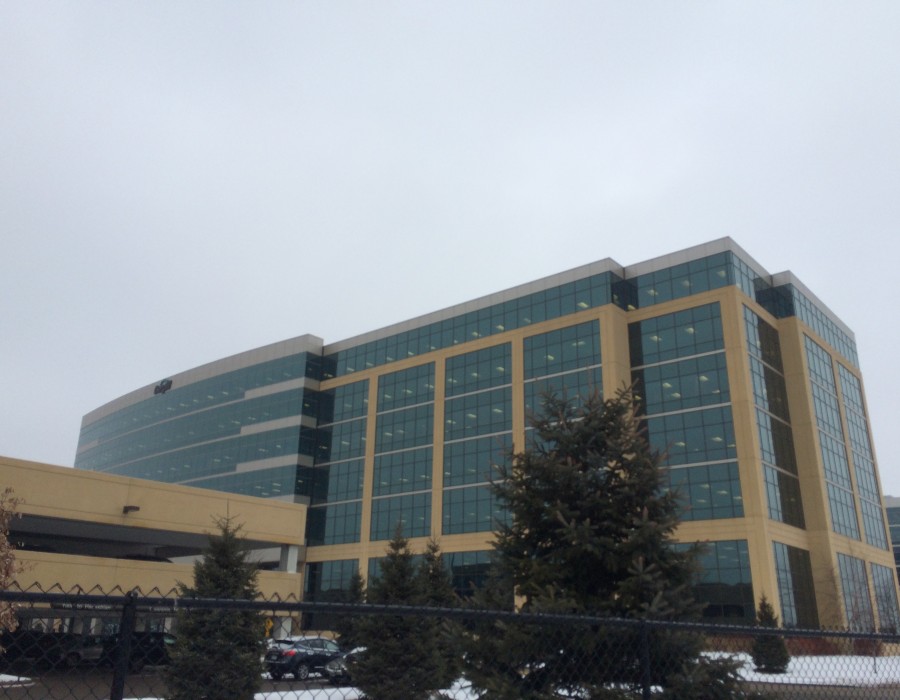
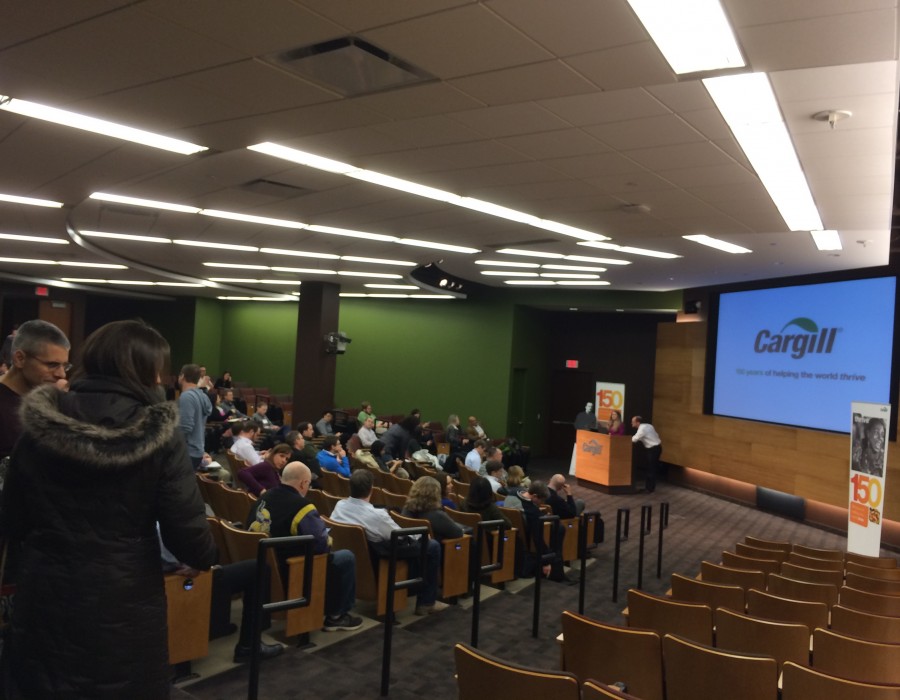
I walked from Colectivo’s Third Ward location to the speaking venue, which was generously hosted by MGIC. Special thanks to Tracy Childs and Nick Bachofen of MGIC for the flawless room setup and internet access.

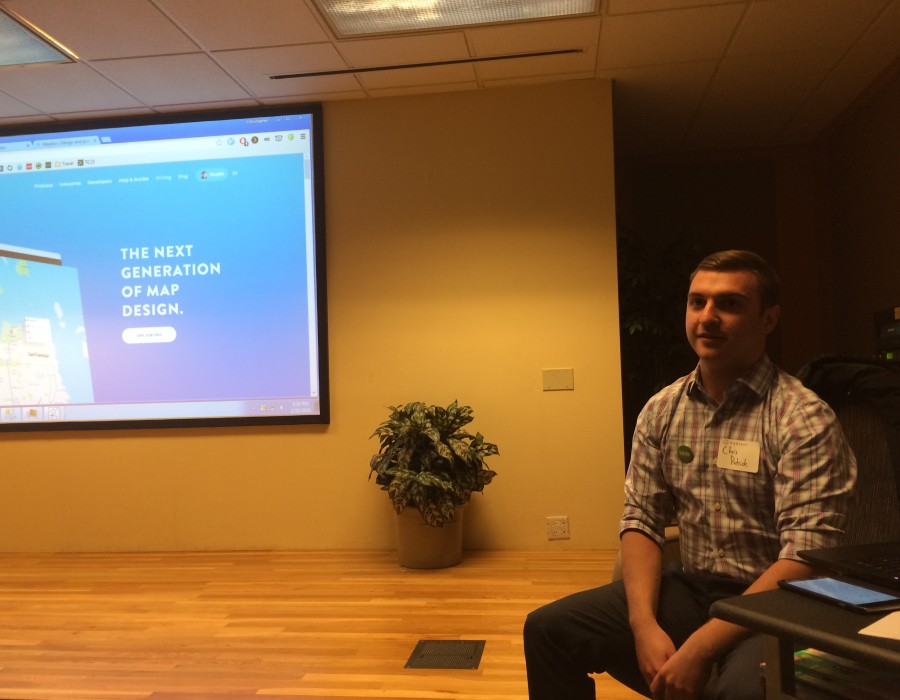
Since my last visit, my friend, Sarah Nell (a.k.a Viz_Dork), left Milwaukee and joined Tableau’s training team. Brandi Beals of Artisan Partners is doing a capable job of organizing the TUG in Milwaukee these days. I also want to point out that there were some excellent presentations from Milwaukee TUG Members. Olga Rosales of MCIG provided some insight into the challenges and opportunities experienced during their ongoing Tableau rollout at MCIG, and Chris Patrick of Artisan Partners did a great three-minute demo of Tableau and Mapbox.

During and after my talk, I received a lot of good questions. There were also lots of good general questions and interaction at the end of the TUG meeting. Unfortunately, I had to catch a flight back to Atlanta and wasn’t able to attend the happy hour get together following the meeting.

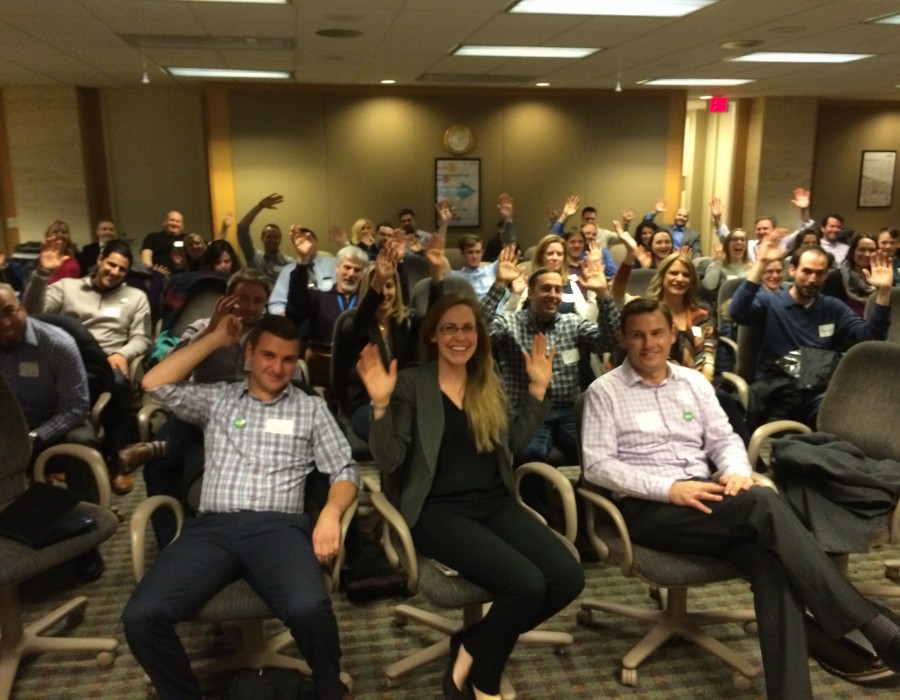
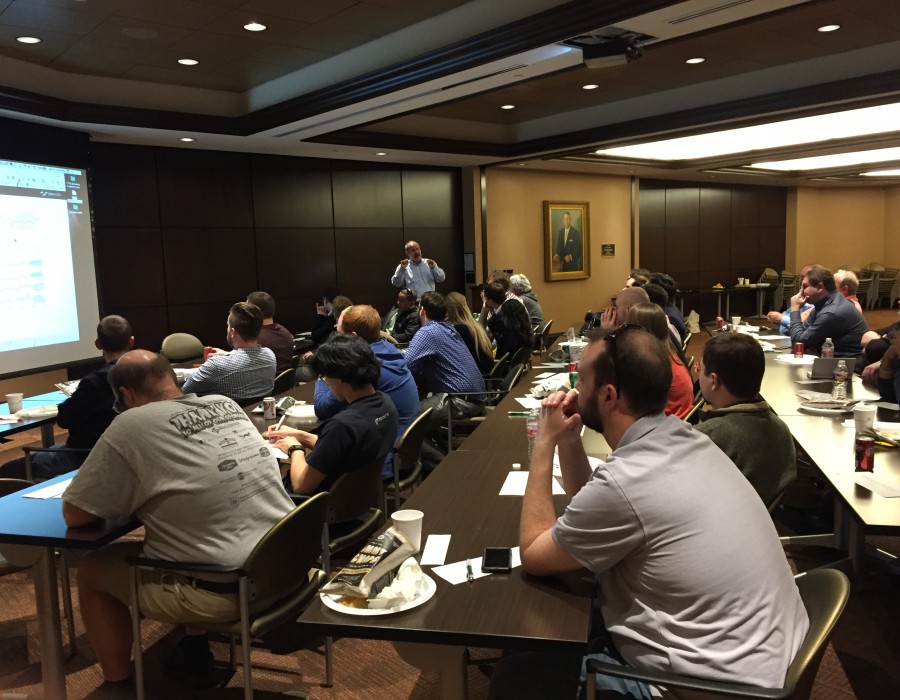
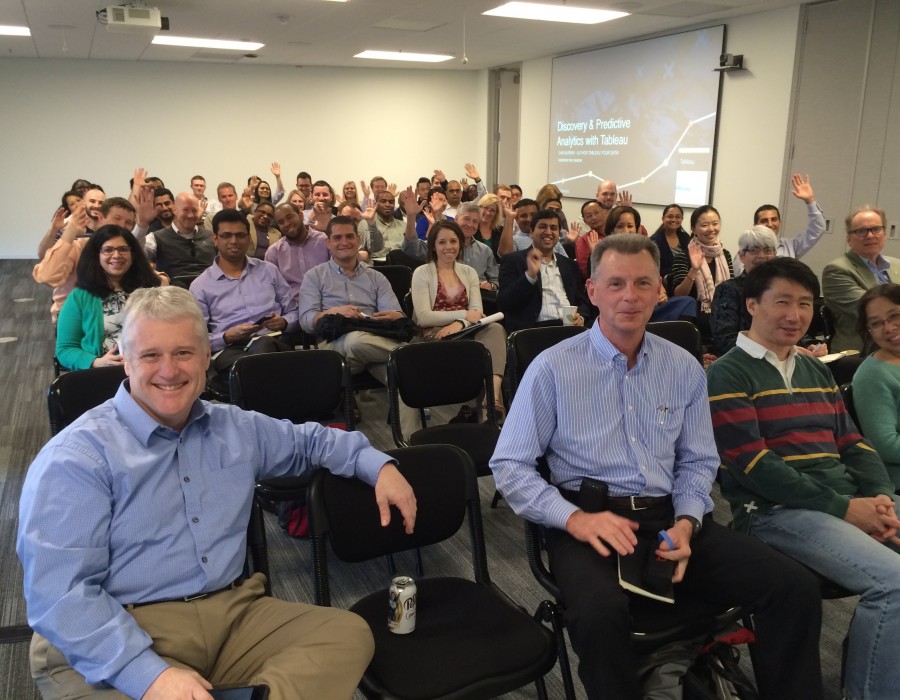
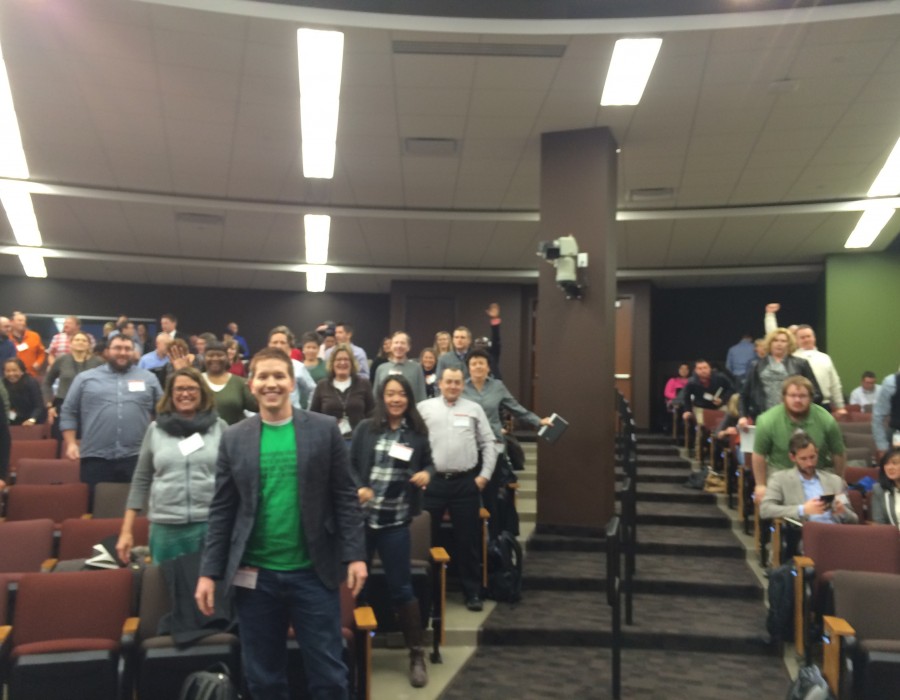
There were a lot more people at this TUG meeting than my last visit. Tableau appears to be alive and well in Milwaukee with an active and engaged user group!

Below is my slide deck from the presentation followed by the relevant files:


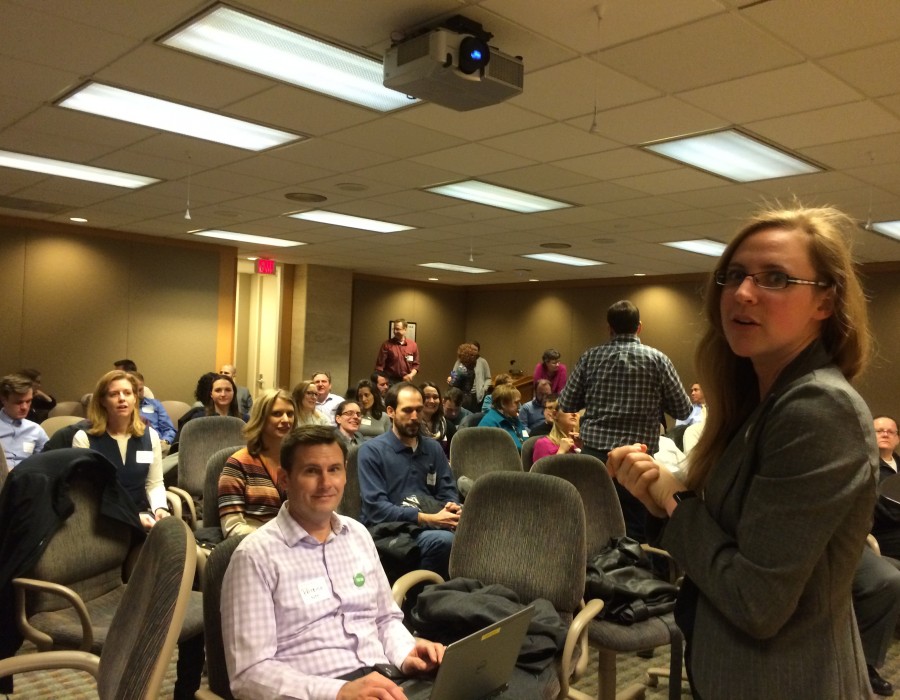
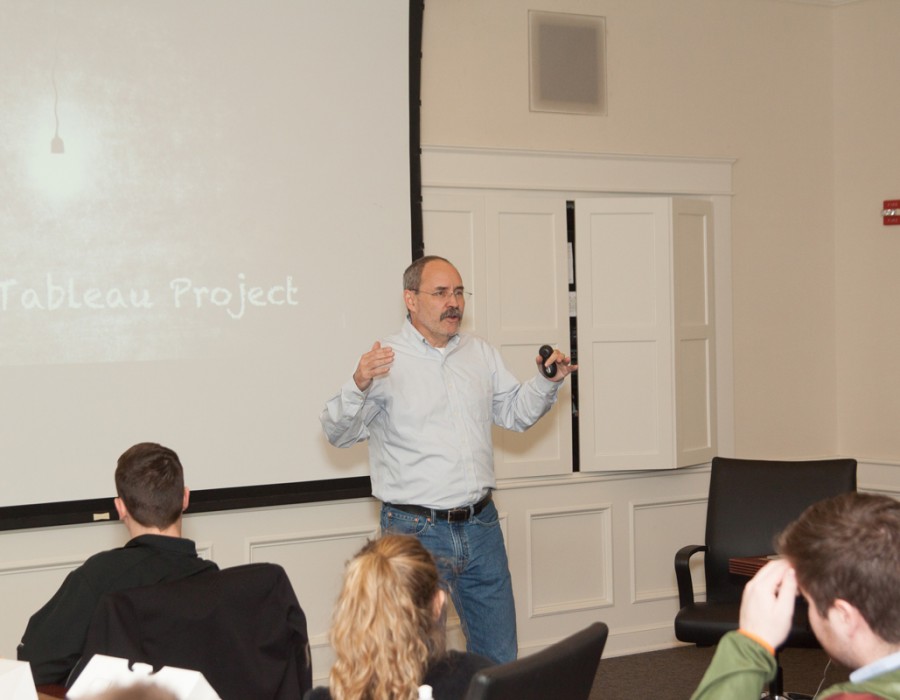
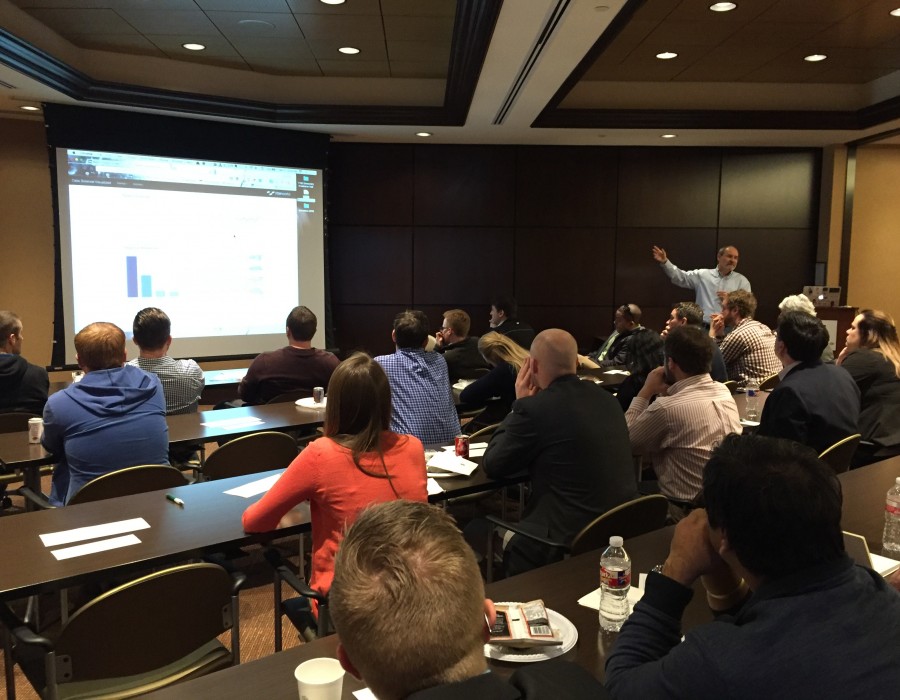
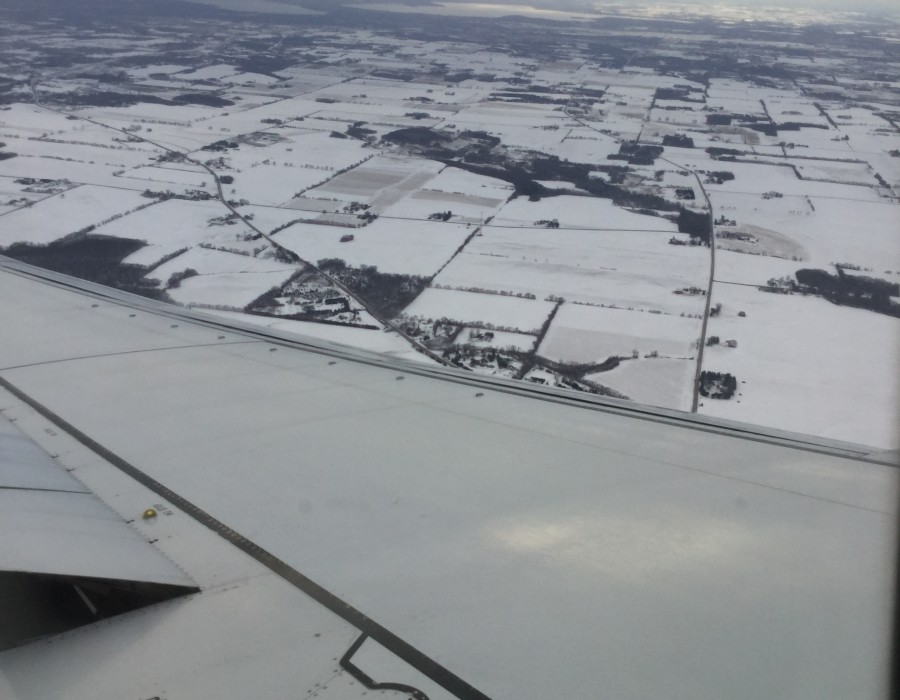
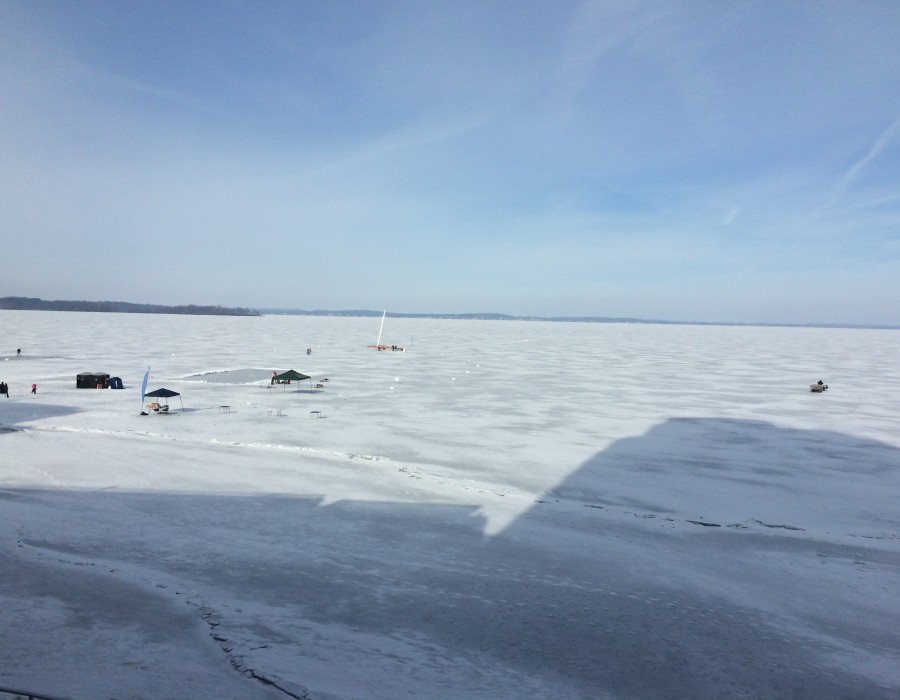
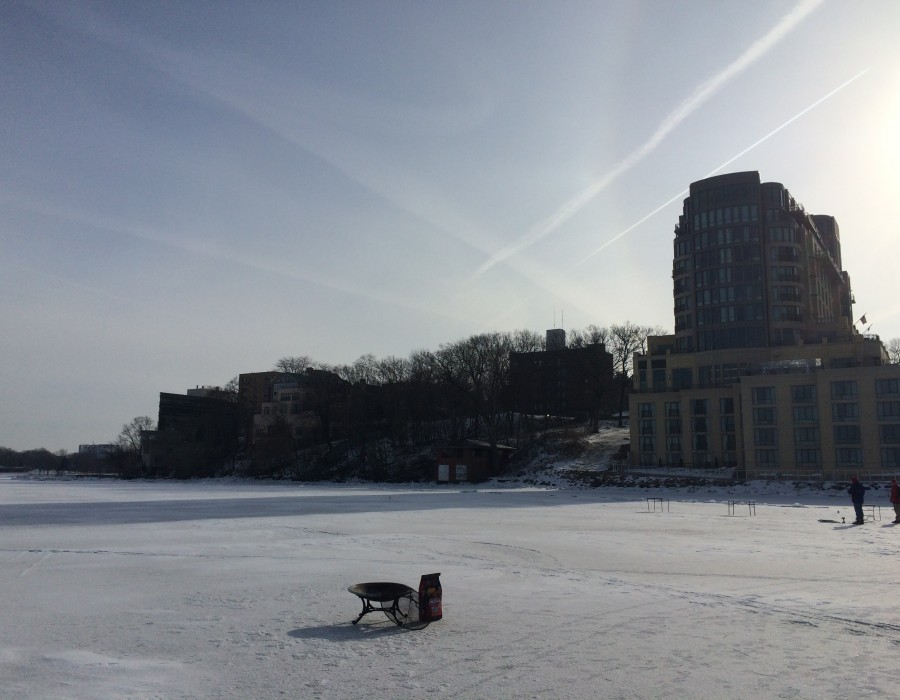
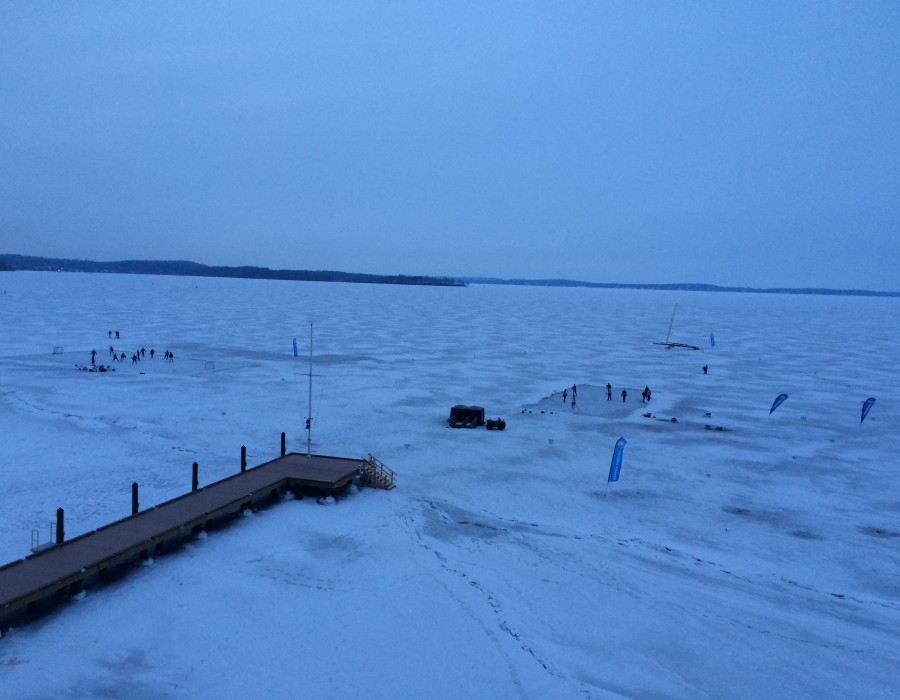
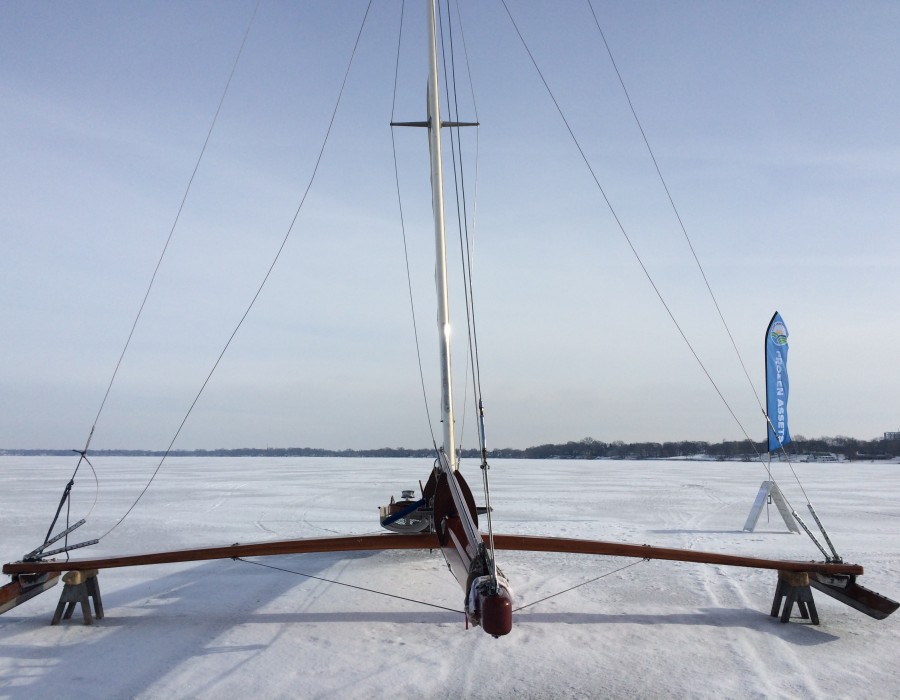
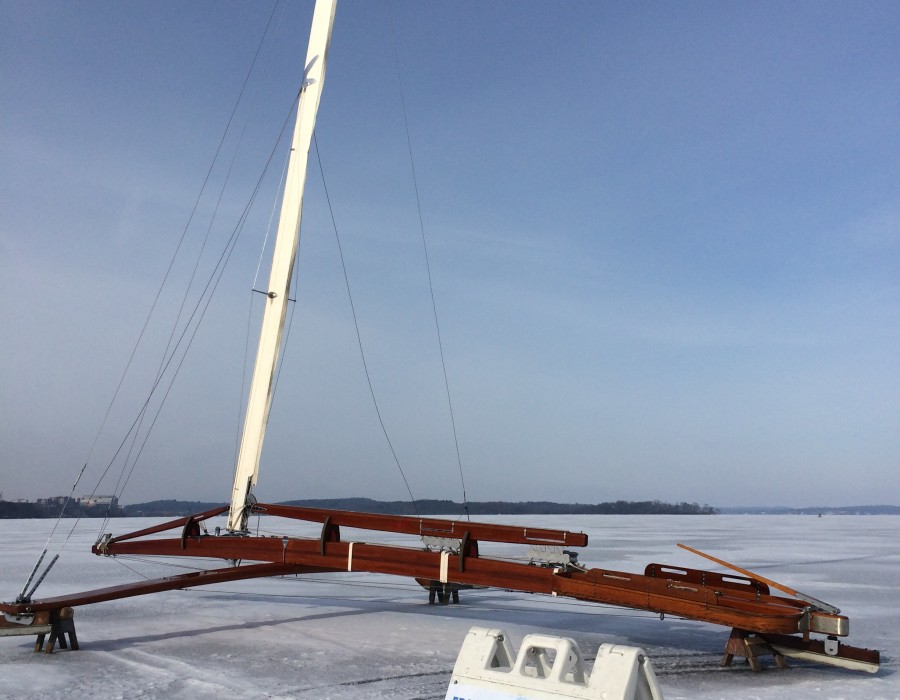
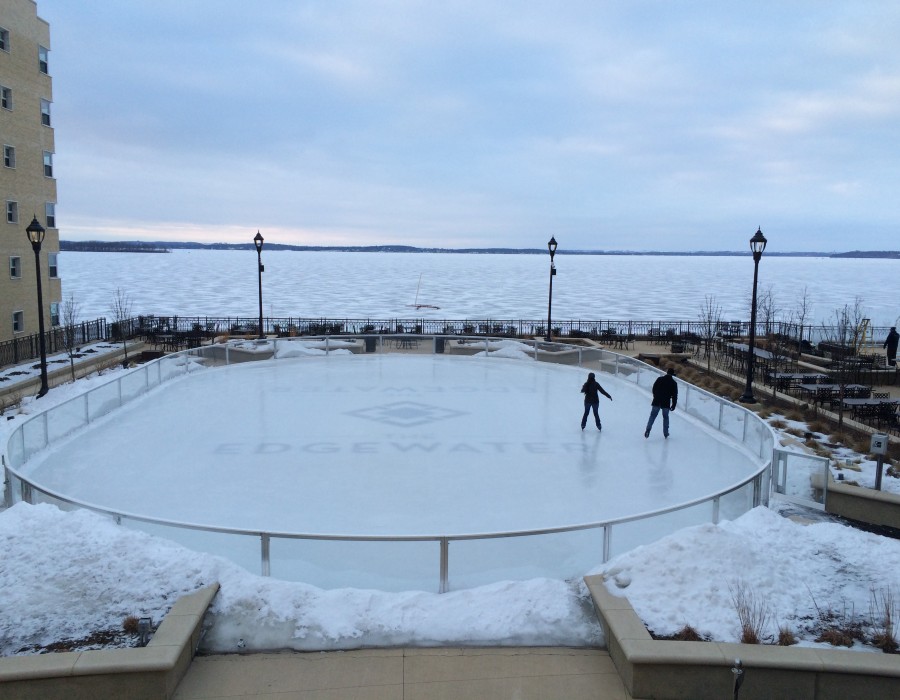
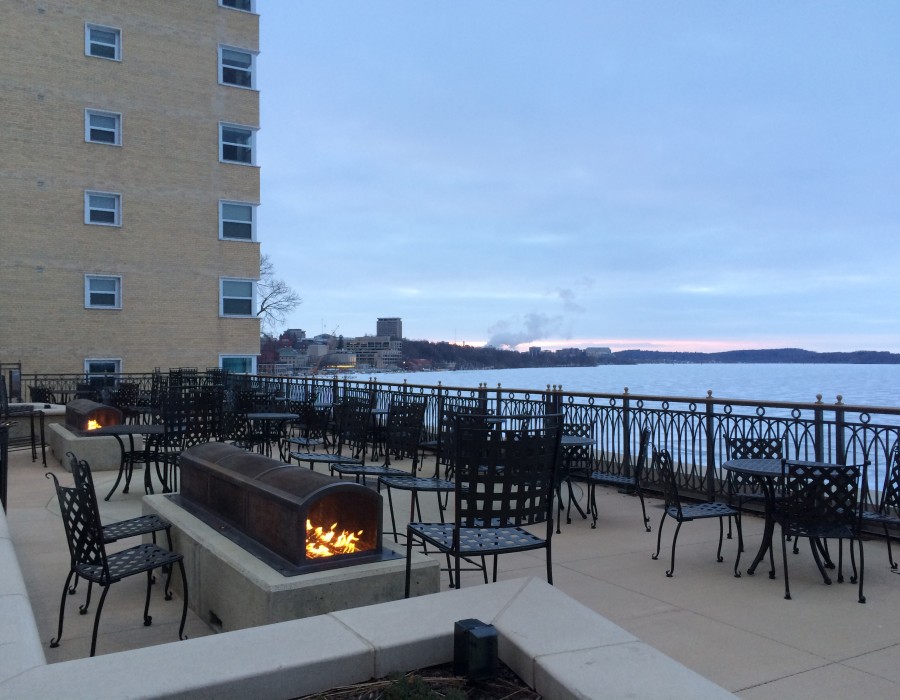
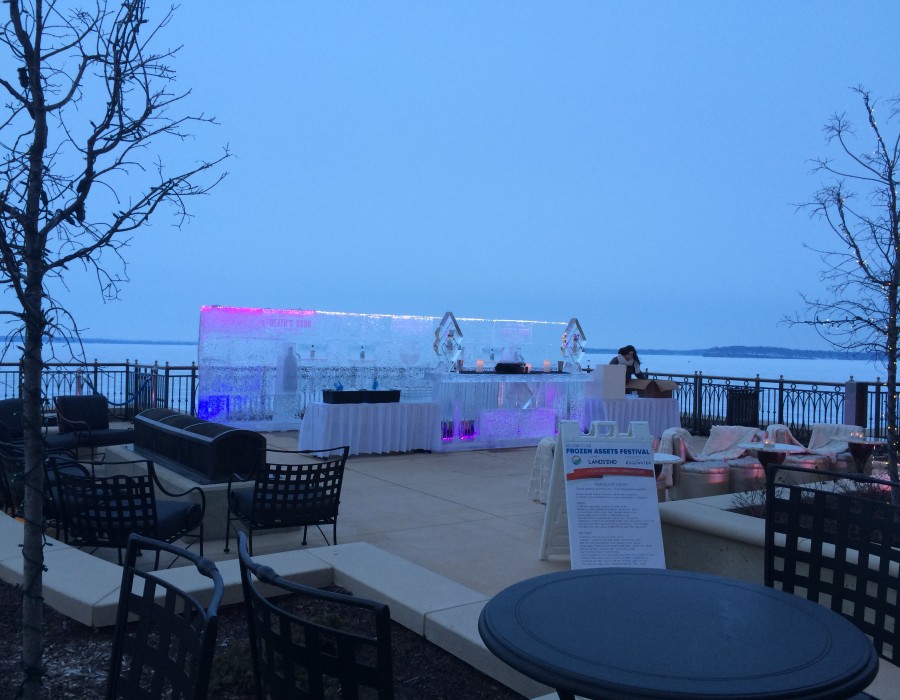
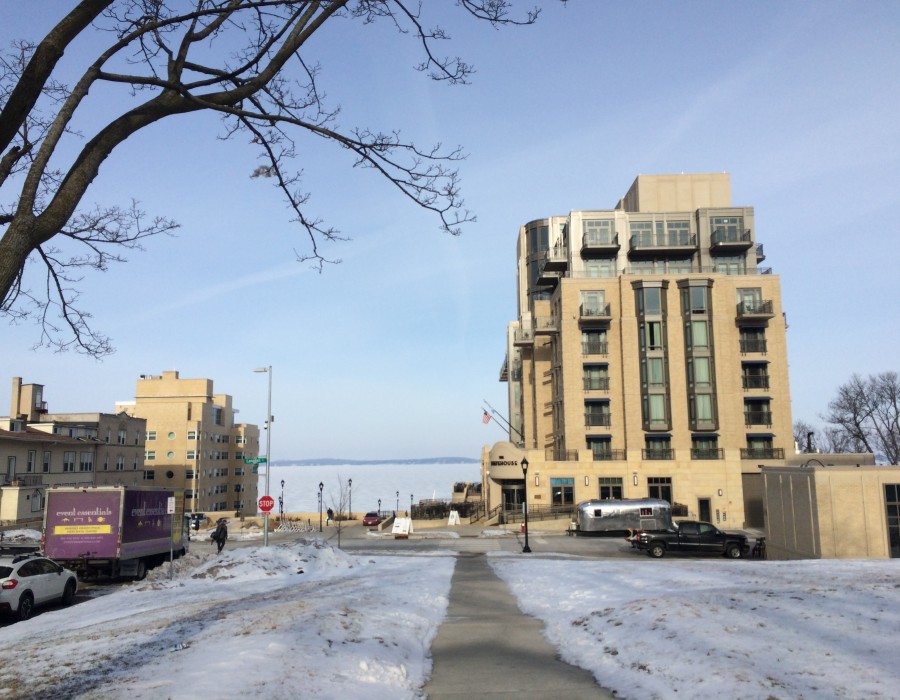
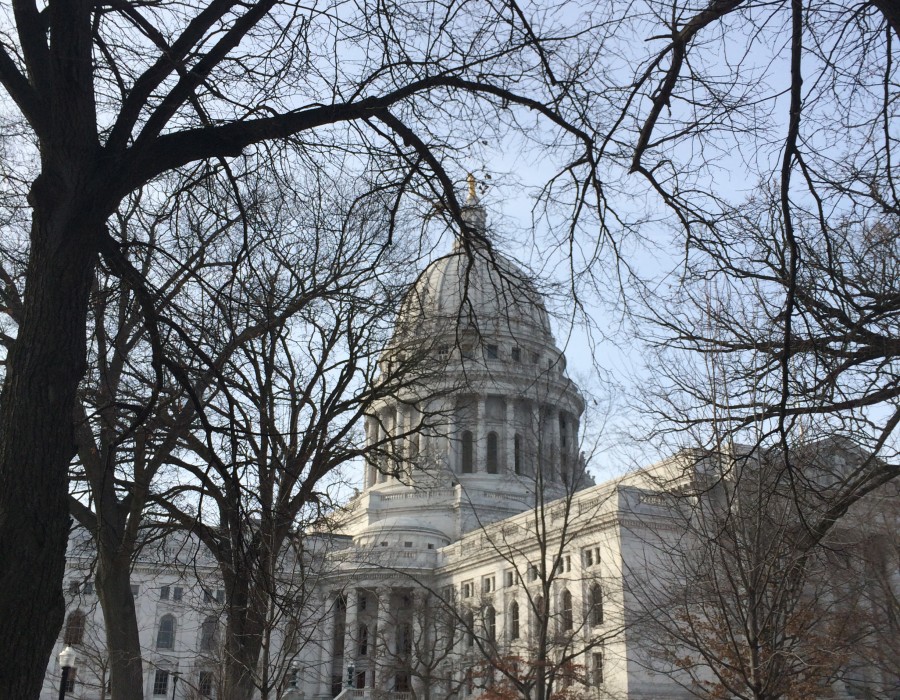
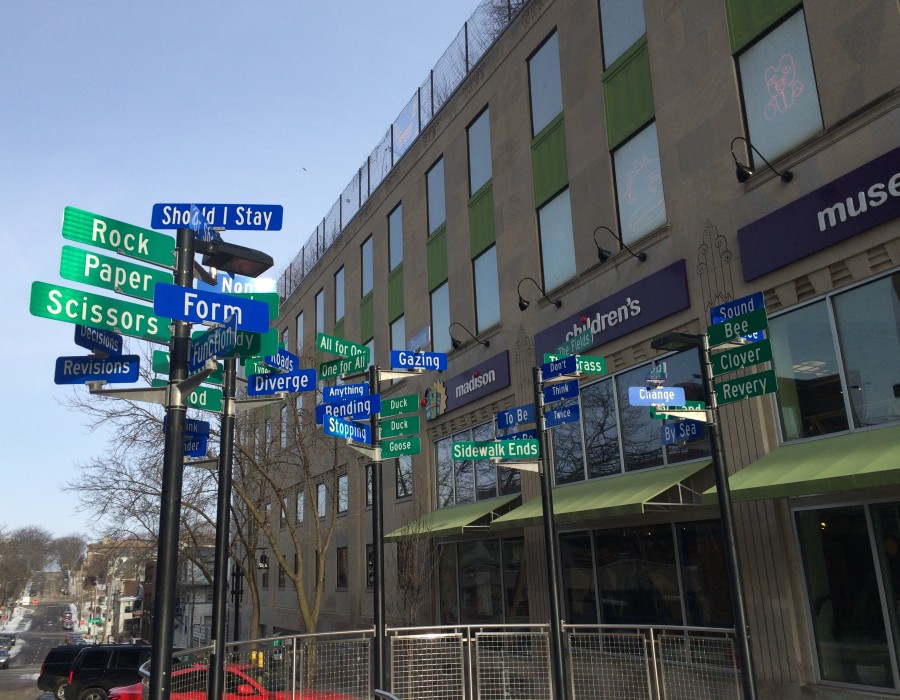
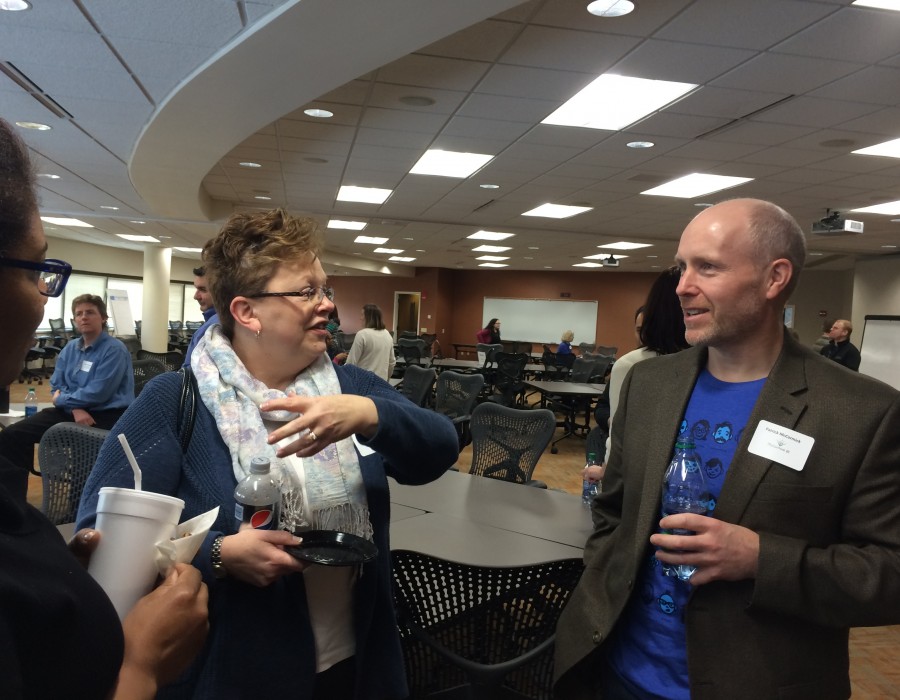
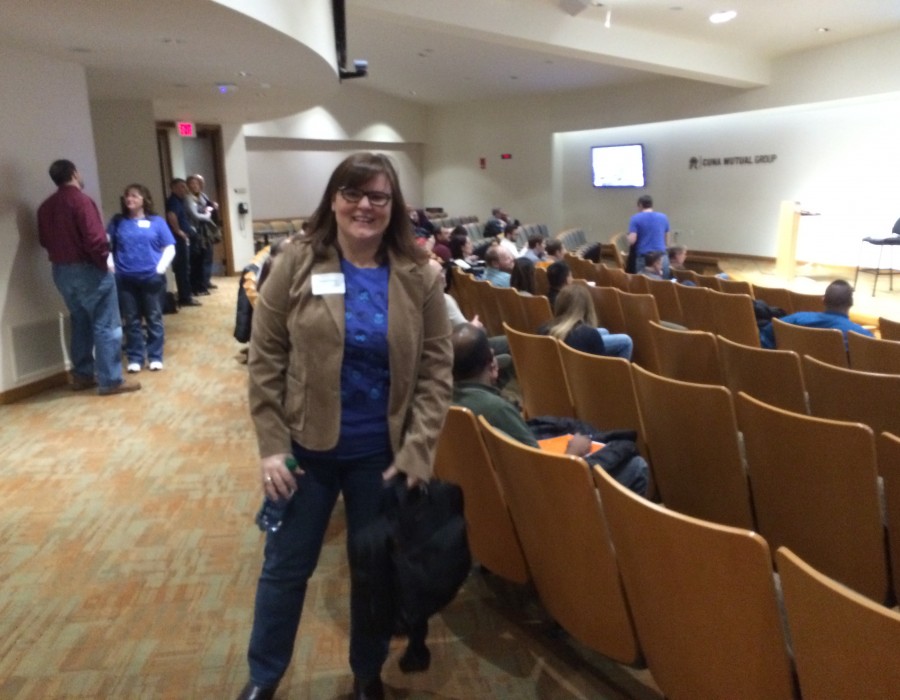
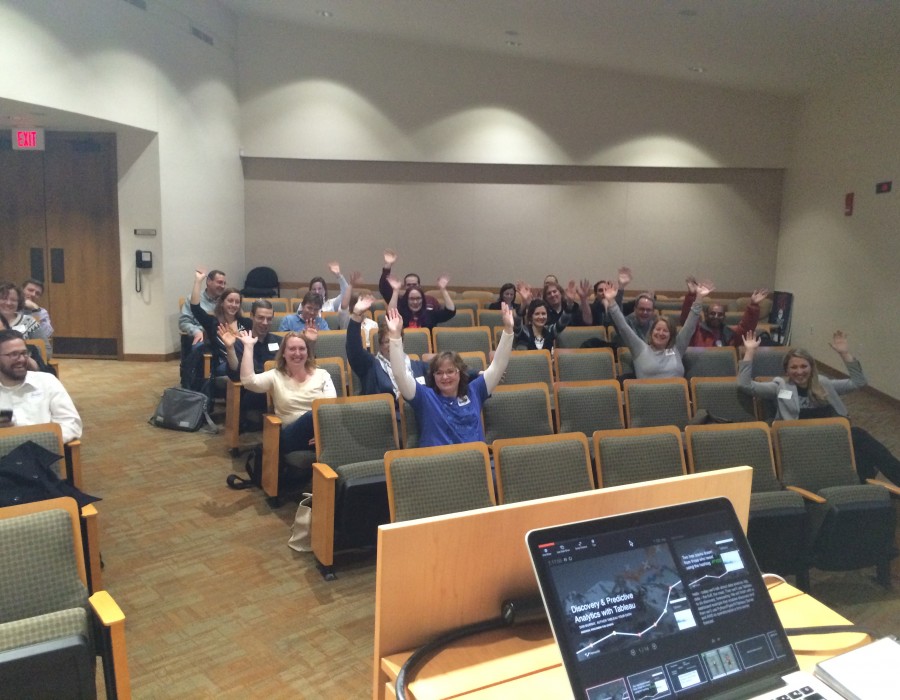
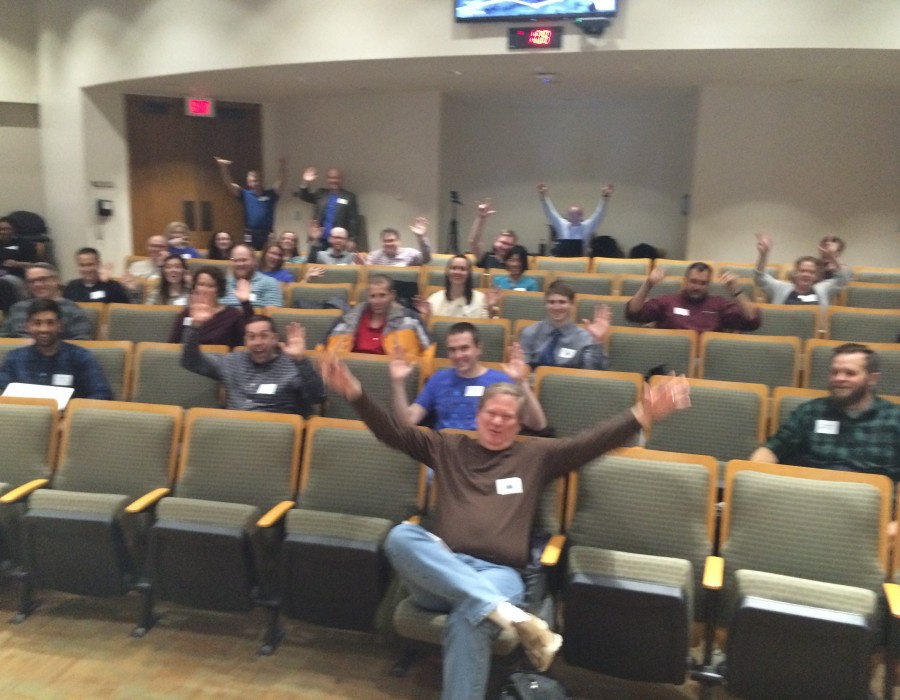
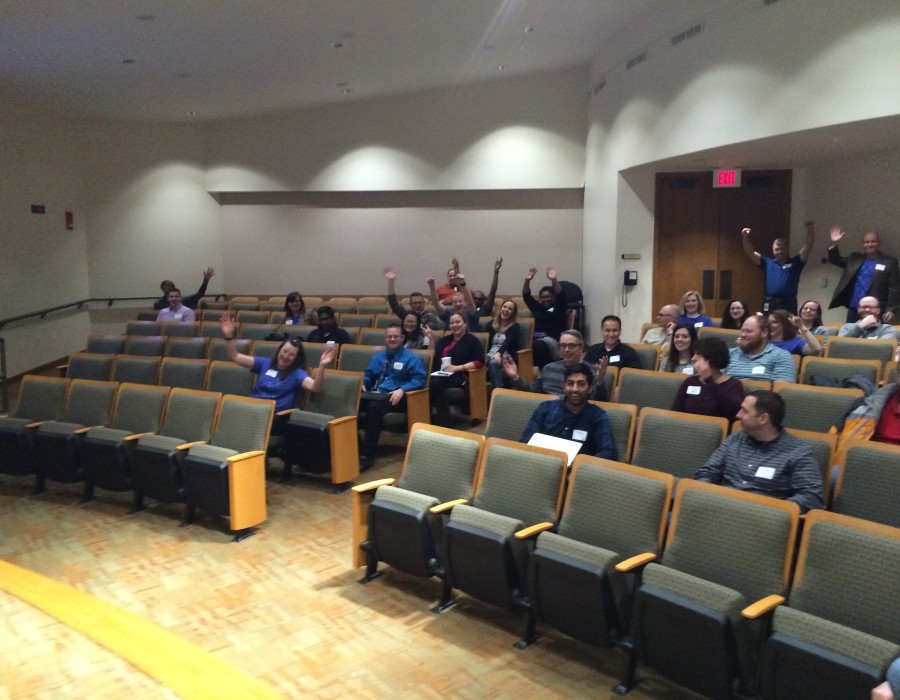
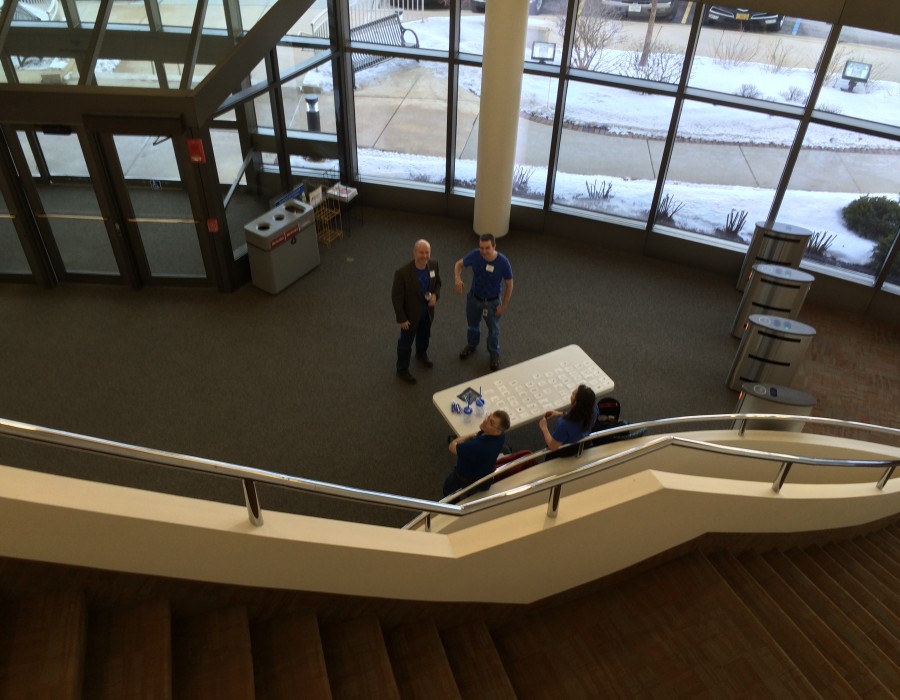
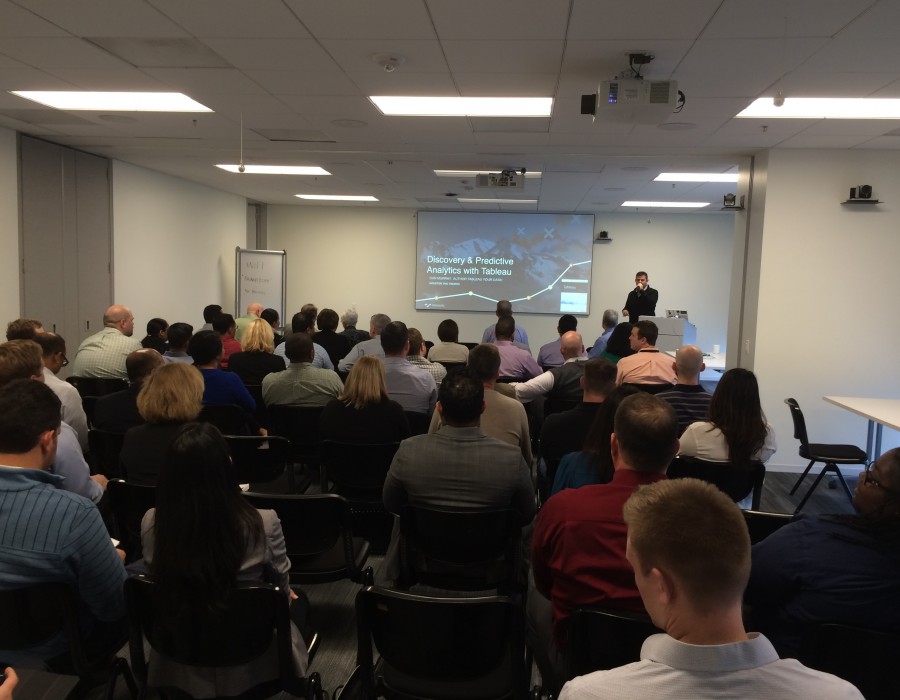
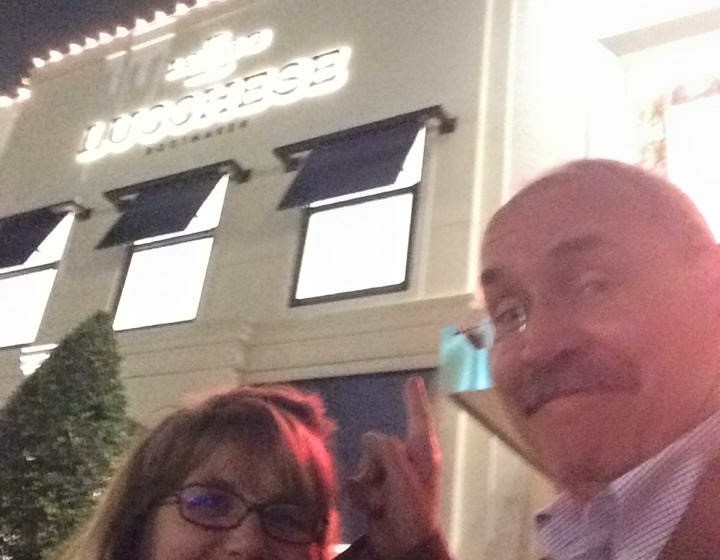
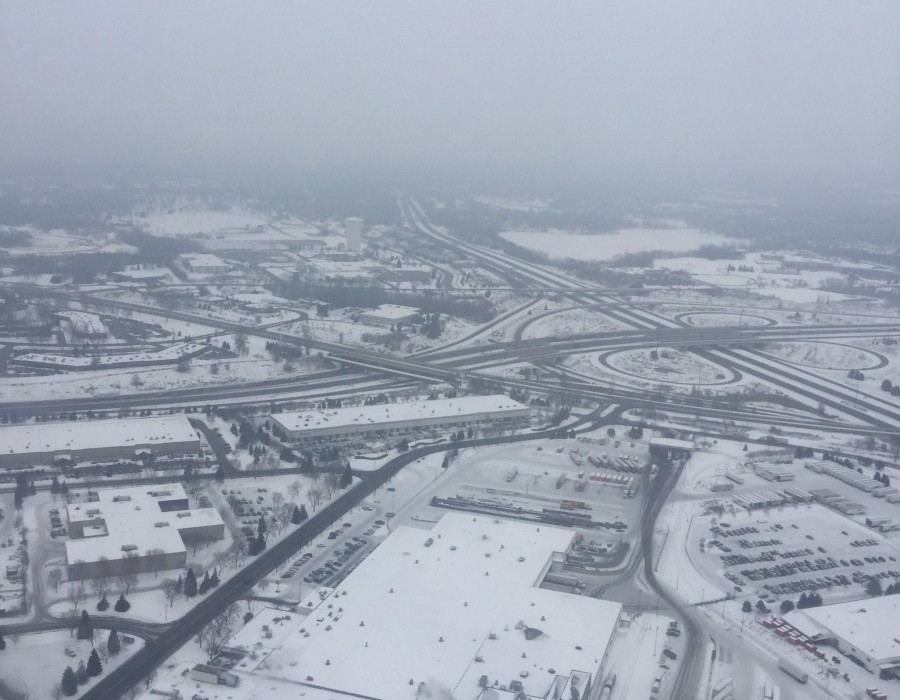
Here are a few photos:

TYD2 Tour Journal: My Week in Oklahoma

Posted - Feb 18th, 2016
Facebooktwittergoogle_pluspinterestlinkedinmailFacebooktwittergoogle_pluspinterestlinkedinmail

I enjoyed visiting our Stillwater HQ and our Oklahoma City office. On Monday, I taught a class for computer science students at Oklahoma State University. The class is run by Professor Behfar Jahanshahi, who also has some other responsibilities.

Tuesday, I did a talk at the Stillwater TUG. This group specifically request the “talk you did in London” a couple of years ago. So, I did an updated version of that speech for a room full of people, adding some new Tableau features into the material.

On Wednesday, I journeyed down to Oklahoma City and did a 60-minute version of my 90-minute talk on predictive and discovery analytics using Tableau.

All of the talks were well received. What’s so fun about this is that eight years ago, nobody had heard of Tableau and it was very difficult to get anyone in Oklahoma to listen to a talk about visual analytics. That has clearly changed; everyone is interested.

Below are my slide decks from the presentations (be warned, the first is big) followed by the relevant files:


Here are a few photos from Stillwater and OKC:

TYD2 Tour Journal: Anthem Insurance

Posted - Feb 11th, 2016
Facebooktwittergoogle_pluspinterestlinkedinmailFacebooktwittergoogle_pluspinterestlinkedinmail

Today, I did a virtual talk with Anthem’s internal Tableau User Group. There were around 120 people in attendance. The slide deck and supporting workbooks can be found at the links below. I also mentioned a paper on the last 50 years of data science by David Donaho. As your Tableau Server deployment grows, check out our Power Tools for Tableau products. They help you manage, govern and standardize content on server.


TYD2 Tour Journal: Madison

Posted - Feb 9th, 2016
Facebooktwittergoogle_pluspinterestlinkedinmailFacebooktwittergoogle_pluspinterestlinkedinmail

The last time I was in Madison to give a speech, the high temperature was around 10 below zero. This time, it was a relatively balmy 28 degrees. I took the opportunity to walk around the city near the State Capital Building, the University of Wisconsin campus and Lake Mendota.

The hotel I was staying at had a weekend fundraising event planned, which included an outdoor icebar, an iceboat and other things on the frozen lake.

I had dinner the evening before with the Madison team leaders, including Pat McCormick, Abby Posey, Clare Huhn, Dan Mazzocchi and Matthew Van Straten. We talked data viz and the projects they were working on. This team represents the consulting, government, insurance and software industries. Special thanks to Clare for the ride on Thursday and Pat for the ride on Friday.

Credit Union National Association (CUNA) Mutual hosted the event in a nice venue. There were around three times the number of people at this event than the last time I spoke. I give this TUG team a lot of credit for putting on a quality event. The first hour was spent in a “Birds of Feather” session where people could ask questions about specific areas of interest. I then gave two different talks (2.5 hours) on predictive analytics and discovery with Tableau as well as publishing for mobile consumption. There were lots of good questions. The Madison TUG has their act together. If you live in the area, you should take some time to attend their next event in June.

Below are my slide decks from both presentations, each followed by relevant files:


Next up, I’m headed to the home of InterWorks: Stillwater, Oklahoma. Enjoy these photos from Madison:

TYD2 Tour Journal: Montgomery

Posted - Jan 29th, 2016
Facebooktwittergoogle_pluspinterestlinkedinmailFacebooktwittergoogle_pluspinterestlinkedinmail

Yesterday, I drove a couple of hours down to Montgomery to deliver my 3rd talk on the tour. It was a small but engaged group of Tableau users (15-20 people). Montgomery has been the site of significant historical events so I left a little early and spent an hour walking around Dexter Avenue. This is the main street in town and the site of the State Capitol, the first White House of the Confederacy, the Dexter Avenue Baptist Church (Martin Luther King, Jr. was the pastor) and where Rosa Parks sparked the Montgomery Bus Boycott (1955-1956).

You probably won’t plan vacations around a visit to Montgomery, but if you are driving to Florida for a beach vacation, consider stopping in Montgomery to see these historic sites. This video explains some of the history of the Confederate States of American and Jefferson Davis’s speech on the steps of the current state capitol building.

The Alabama State Capitol.

Rosa Parks and Martin Luther King, Jr. (among many others) helped make the Montgomery Bus Boycott a seminal moment in the United States Civil Rights Movement.

King became a national figure, and a few years later, he gave one of the greatest speeches of the 20th century in Washington, D.C. It was witnessed by over 250,000 people. It’s good to remember these events. Freedom comes at a price.

Below is my slide deck from the presentation followed by the relevant files:


Up next is Madison, WI. Here are some interesting photos from my trip in Montgomery:

TYD2 Tour Journal: Houston

Posted - Jan 27th, 2016
Facebooktwittergoogle_pluspinterestlinkedinmailFacebooktwittergoogle_pluspinterestlinkedinmail

My second talk on the Tableau Your Data! 2nd Edition tour was in Houston at BMC Software’s impressive facility. Corresponding with this date was the official availability of the book on Amazon’s website!

I want to thank Robert Hanley, Director of Finance at BMC Software, for sponsoring the Tableau user group in Houston and providing a very nice venue (19th floor of the BMC office) for my presentation. An old friend from my working days prior to consulting (8+ years ago) showed up to say hello, as well.

I had 90 minutes to present “Predictive and Discovery Analytics Using Tableau,” which provided more time for introducing the background related to data visualization, big data and data science.

Around 125 people came for a room that was set up to seat 90. Following the event, I had dinner with InterWorks teammate Stephanie Kennedy. We talked about a number of topics, including the U.S. patent system, which lead me to review their website that night. The USPTO is trying to communicate their workload via dashboards. Unfortunately they are not good examples of best practices.

The slide deck and sample workbooks presented are available for download from the links below:


Montgomery is next. Until then, enjoy these photos from Houston:

‘Tableau Your Data! 2nd Edition’ Now Available!

Posted - Jan 25th, 2016
Facebooktwittergoogle_pluspinterestlinkedinmailFacebooktwittergoogle_pluspinterestlinkedinmail

Hot off the presses, the 2nd edition of Tableau Your Data! is now officially available for purchase on Amazon and Barnes & Noble! This latest edition comes in response to nearly two years of major improvements to Tableau’s already dynamic toolset. With over 150 pages of new content as well as significant updates and revisions to existing chapters, Tableau Your Data! 2nd Edition is much more than a simple facelift – it’s an overhaul. What’s more, it’s already trending at #1 in Amazon’s Math/Statistics category.

Tableau Your Data!

What’s New?

As previously mentioned, there have been several changes in Tableau products over the past two years, many of them huge. As such, author Dan Murray focused largely on updating existing material to be current with Tableau 9.2. This equates to changes in virtually every chapter as well as the addition of two entirely new chapters.

New features and software changes aren’t the only cause for change. As great as the 1st edition was, there was still some room for improvement. Thanks to invaluable feedback provided by the Tableau community, Dan was able to improve several areas to be clearer, more accurate and more relevant.

This post from Dan back in Nov. outlines updates found in the 2nd edition in more detail.

Reflecting on Success, Then Building on It

It’s hard to believe that Tableau Your Data! first dropped two years ago. Even before sending it to Wiley for publication, we knew the book was something special. Prior to release, there wasn’t a clear guide that adequately explained how Tableau fit into the visual analytics puzzle, at least on the enterprise level. Author Dan Murray and the InterWorks team changed all that with Tableau Your Data!

Since then, this best-selling guidebook has received praise from Tableau employees, Tableau Zen Masters and novice users alike. Not only does it sit in the libraries of some the sharpest data minds in the industry, it’s become the curriculum of choice for Tableau classrooms around the world.

This makes us incredibly proud, and the 2nd edition was written with the intent of building on that success. We’re confident that it will further your Tableau education and serve as a resource that you will come back to regularly. We hope you enjoy it and look forward to hearing your feedback!

To hear Dan’s personal thoughts on the 2nd edition, check out his “Letter from the Author.” You might also want to attend one of his upcoming book tour dates. Finally, to purchase your own copy of Tableau Your Data! 2nd Edition, head to the online retailer of your choice below:

amazon-prebn-pre


TYD2 Tour Journal: Minneapolis

Posted - Jan 22nd, 2016
Facebooktwittergoogle_pluspinterestlinkedinmailFacebooktwittergoogle_pluspinterestlinkedinmail

Dan shares his thoughts from the Minneapolis stop on the Tableau Your Data! 2nd Edition book tour.

The Tableau Your Data! 2nd Edition book tour got started yesterday at Cargill HQ in Hopkins, Minnesota. Cargill is the largest privately-owned company in the world with revenues exceeding $120 billion, and they have over 150,000 employees scattered across 70 countries. Check out the dashboard I built earlier this week to see a Forbes listing visualized with with 200+ of the largest privately-owned companies in the United States.

My talk, “Discovery and Predictive Analytics with Tableau,” was fun. I ran through a bunch of examples that the audience seemed to enjoy and gave away two free copies of the new book to attendees who tweeted something about the talk using #TYD2. You can view the slides from my full presentation below:

In addition to viewing the presentation, you can download all of the example dashboards and data sets I used below:

Next week I’m heading to Houston, Texas, and Montgomery, Alabama. Come and say hello! In the meantime, enjoy a few photos from Minneapolis.

Dan Talks ‘Tableau Your Data! 2nd Edition’ on the ‘Tableau Wanna Be’ Podcast

Posted - Jan 20th, 2016
Facebooktwittergoogle_pluspinterestlinkedinmailFacebooktwittergoogle_pluspinterestlinkedinmail

Just recently, Dan Murray was featured on the hit “Tableau Wanna Be” podcast hosted by Matt Francis and Emily Todd Kund. This is the second time that Dan has been on the podcast, and this time, he focuses primarily on details surrounding Tableau Your Data! 2nd Edition. Specifically, the conversation covers:

  1. InterWorks’ Tableau Partner of the Year awards
  2. What’s new with Tableau Your Data! 2nd Edition
  3. The book companion website and blogging
  4. The upcoming book tour
  5. Favorite new features in Tableau
  6. What are Dan’s three wishes for Tableau/data viz?
  7. Other off-the-cuff stuff (v9.3, v10, Tapestry)

You can listen to the entire podcast below:

Letter from the Author – 2nd Edition

Posted - Jan 19th, 2016
Facebooktwittergoogle_pluspinterestlinkedinmailFacebooktwittergoogle_pluspinterestlinkedinmail

The 2nd edition of Tableau Your Data! required over 1,000 hours of research and writing. More than 500 new visualizations were created using the OS X and Windows versions of Tableau. Writing this update was a considerable amount of work.

Writing a book is a lot of work. Writing an update to a book on Tableau is also a lot of work. Tableau Software continues to add features. As a result, this edition is 169 pages longer than the 1st edition. In addition, significant new content was added in nearly every chapter. The function reference in the appendix was updated, adding more than 40 new functions.

I’m also going to actively update the companion website every month because Tableau Software plans to accelerate their release cadence. As new features are released, I’ll provide updated coverage and index it to the related sections in the book.

At Tableau Conference 2015 in Las Vegas last year, I was excited by the feedback I received from readers of the 1st edition. Many people told me that the book was the only reference material they used to successfully prepare for the Tableau certification exam. We were also thrilled that people from every continent were readers of Tableau Your Data! I hope that you find the 2nd edition to be as helpful as the first.

I want to thank Dick Holm for his patience and excellent feedback. Dick provided technical editing for the 2nd edition. His perspective was helpful and, I believe, improved the clarity and content of this version. There are other Tableau guidebooks on the market, but I believe Tableau Your Data! is the only one that provides coverage of both the Desktop and Server products.

Of course, this book wouldn’t be possible without the insight and help of the InterWorks team and our clients. Thank you all for sharing your insights!

Dan Murray