InterWorks recently wrapped up their extended U.S. “Tableau Your Data!” tour and are ready to do it all again, this time on a different continent! Due to overwhelming interest from European Tableau fans, InterWorks plans to bring the tour to eight European nations. The tour gives Tableau users across Europe the opportunity to meet with one of the leading minds in data visualization. Book author and InterWorks’ Director of Business Intelligence Services, Dan Murray, will speak at Tableau user groups in select European cities this July. The tour begins in London on July 9 following Murray’s presentation at the Tableau Conference on Tour.
Major topics covered by Murray during tour events include:
His first Tableau project, and what he learned
Getting your organization to buy into Tableau
Successful Tableau deployment strategies and tactics
Building effective dashboards
Dealing with the “data flood”
After each speech, attendees can ask Murray any questions they may have about “Tableau Your Data!” or Tableau in general. InterWorks will also give away a few free copies of “Tableau Your Data!” at each event.
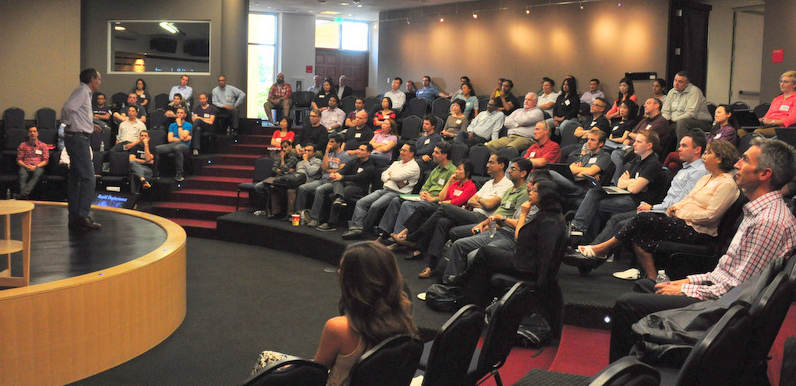
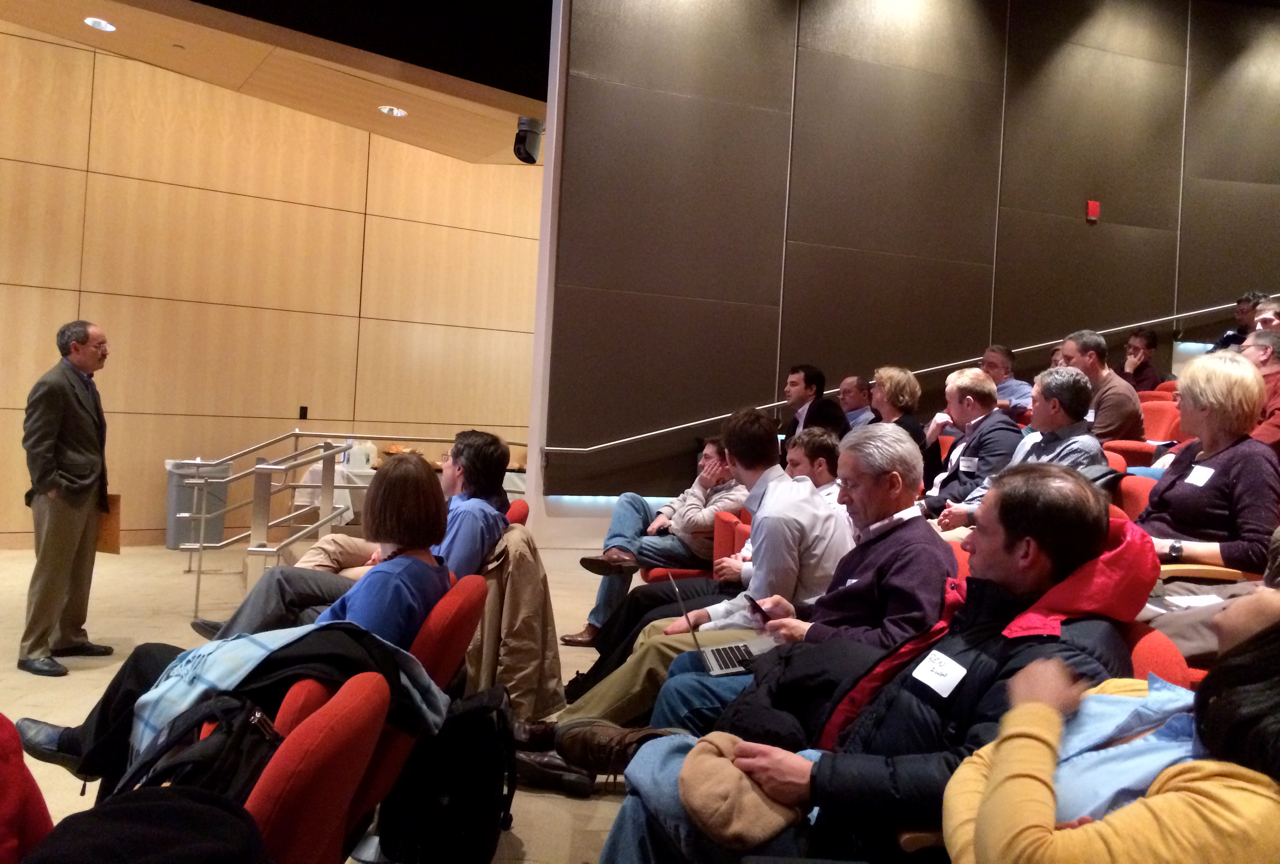
Above: Murray speaking to the San Francisco Bay Area TUG.
Listed below are our current European tour dates. To learn more about each event, head to the InterWorks EU Events page. Check back for updates.
London, United Kingdom
July 9
The Brewery
Dublin, Republic of Ireland
July 10
AON
Manchester, United Kingdom
July 11
Atria Buildings
Amsterdam, Netherlands
July 14
Radisson Blu Hotel
Oslo, Norway
July 15
Radisson Blu Plaza Hotel
Munich, Germany
July 16
Courtyard by Marriott
Zurich, Switzerland
July 17
Zurich Marriott Hotel
Antwerp, Belgium
July 18
Delaware Consulting
Paris, France
July 21
Criteo
London, United Kingdom
July 22
The Theatre, Blue Fin Building
About Dan Murray
Based out of Atlanta, GA, Murray serves as Director of Business Intelligence Services for IT and data consulting firm, InterWorks. He holds over 30 years of business experience in key roles such as CFO, CIO, COO, VP of Planning and VP of Operations. Murray maintains a reputation as a leader in the fields of data visualization and business intelligence, particularly within the Tableau community. He helped create the first Tableau User Group in the U.S., in addition to founding several others.
About InterWorks
InterWorks is a full-service, IT consulting firm specializing in data-driven business solutions. As the first Tableau Gold Partner and Tableau’s 2013 North American Partner of the Year, InterWorks boasts one of the largest and most talented teams of Tableau consultants in the world. InterWorks pairs Tableau expertise with the added benefit of being a comprehensive IT services provider. These competencies, combined with years of multi-industry experience, equips InterWorks with the tools needed to meet any data challenge today.
“Tableau Your Data!” author, Dan Murray shares his experience at Facebook VizCup 2 …
I was recently invited to speak at Facebook and also act as a judge at their second data visualization competition, VizCup 2. Yesterday, I joined the fun at One Hacker Drive in Menlo Park. For those of you with the IQ and drive, there are few places on earth (sans InterWorks) that can rival the assembled mass of cool, fun and brains that you find at Facebook.
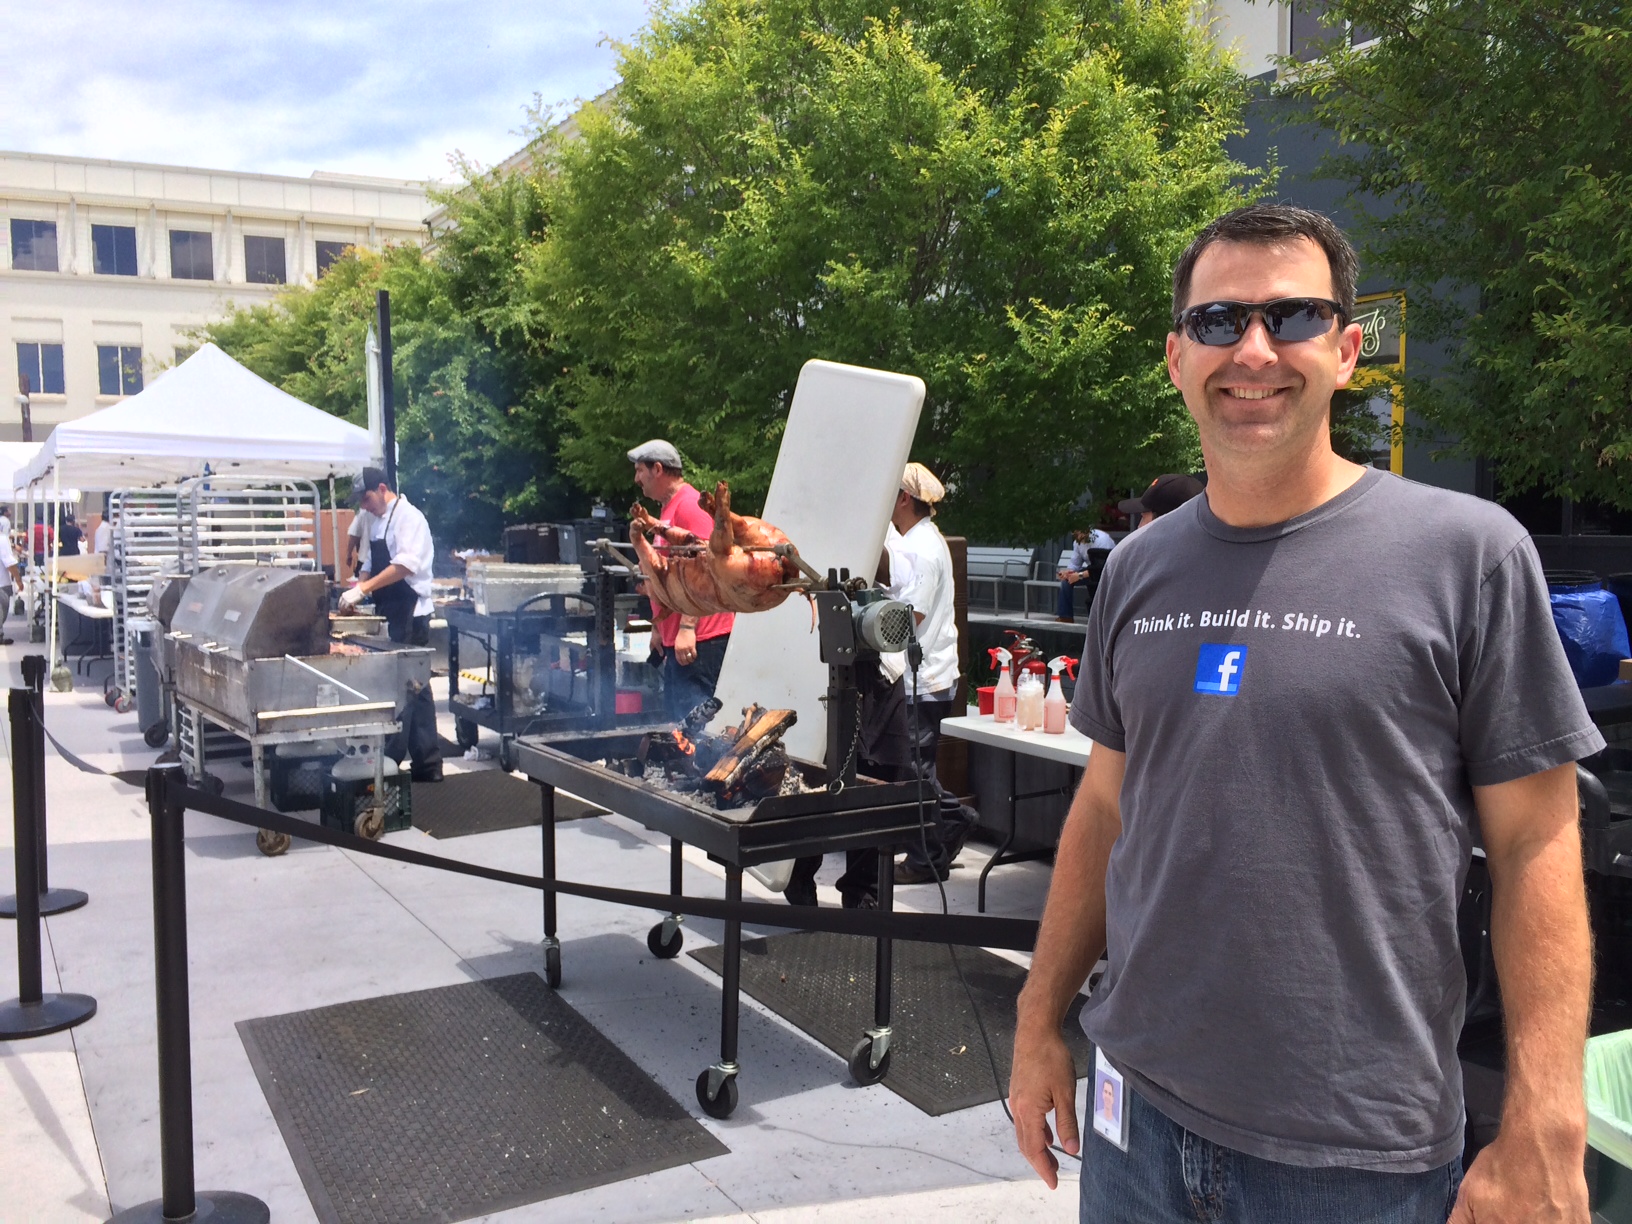
The Updated Facebook Tour – Now with Interns and a Luau
This is the third time I’ve been to the campus, and every time I come, the Disney-like park just seems more lively and fun. It was an intern recruiting and Hawaiian Luau day to go along with the VizCup competition, so the whole bundle was even more entertaining than normal.
My friend and Tableau Zen Master, Andy Kriebel, gave me the updated tour. This time, we saw the roasting pigs. They don’t mess around at Facebook—to throw an authentic luau, you must have real roasting pigs! I decided to sample some, and it was delicious. Later, we sampled some of the equally excellent ice cream that is provided every day to all Facebook employees and any lucky visitors.
Above: Andy Kriebel standing in front of one of the roasting pigs.
The Speech
After lunch, I gave my speech. It was well-attended. The questions afterwards were smarter than average, and the one I enjoyed the most was a database “single-version-of-the-truth” variant delivered by an undoubtedly talented, hardcore database architect from Facebook.
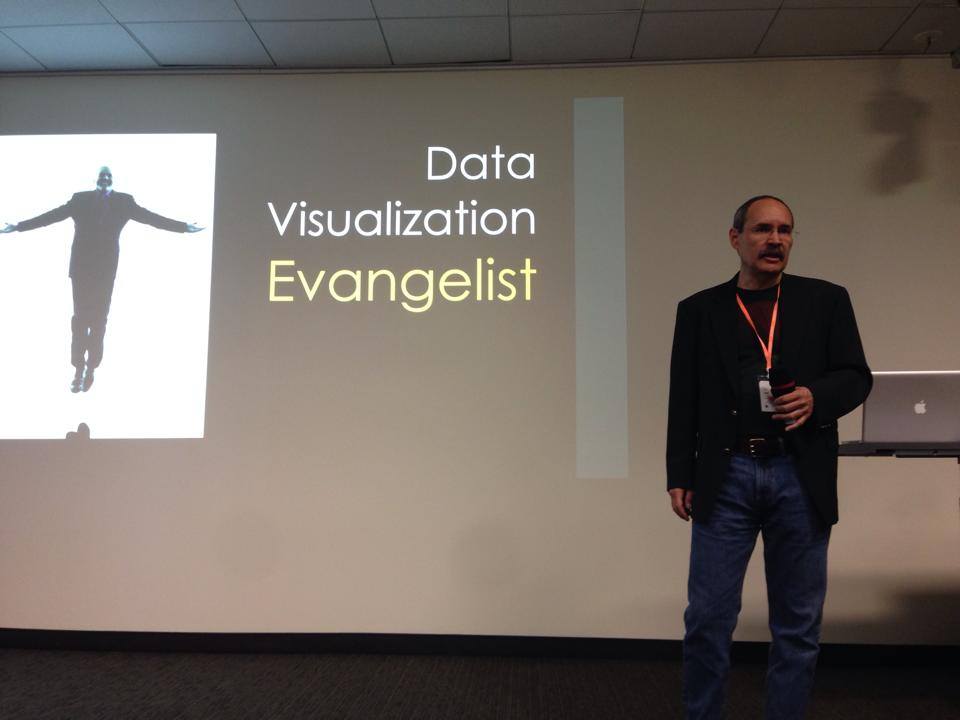
I took the opportunity to tell them that pursuing the “single-version-of-the-truth” hypothesis is a noble goal, but it’s a lot like chasing unicorns at the end of rainbows. You really never get there, other than in very limited domains. In today’s world, it’s impossible to have a single version of the truth when that comes from so many pipes that are of the NoSQL variation.
Above: A photo of me speaking to the Facebook crowd, courtesy of Andy Kriebel.
The questioner took my mild verbal assault well, and we had a longer and more meaningful chat during the VizCup competition later in the day. That’s one of the things I like about Facebook people. They ask good questions. If you don’t give them the answer they may have been expecting, they ask even more questions and generously offer their perception on the matter. Those perceptions always provide valuable bits of insight.
The VizCup
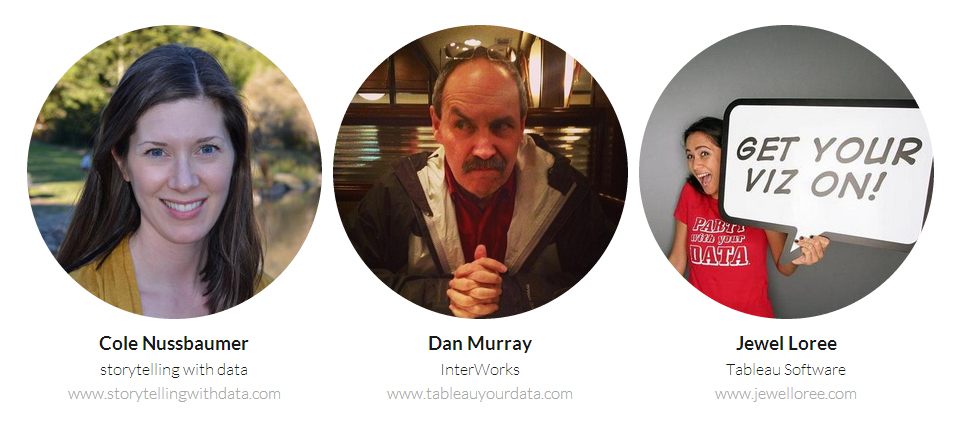
I had the honor of being asked to judge the event along with two intelligent and lovely Tableau employees, Jewell Loree and Cole Nussbaumer. Clearly outmatched in beauty and brains, I opted to offer humor at the appropriate moments. During the 60 minute competition, I wandered the room. Several contestants commented that they loved my book, “Tableau Your Data!” Several freelancers asked if we would be interested in working with them if they got into bigger projects that they were not equipped to handle. My answer—if you are a nice person that is googly-eyed over Tableau—is yes, we are.
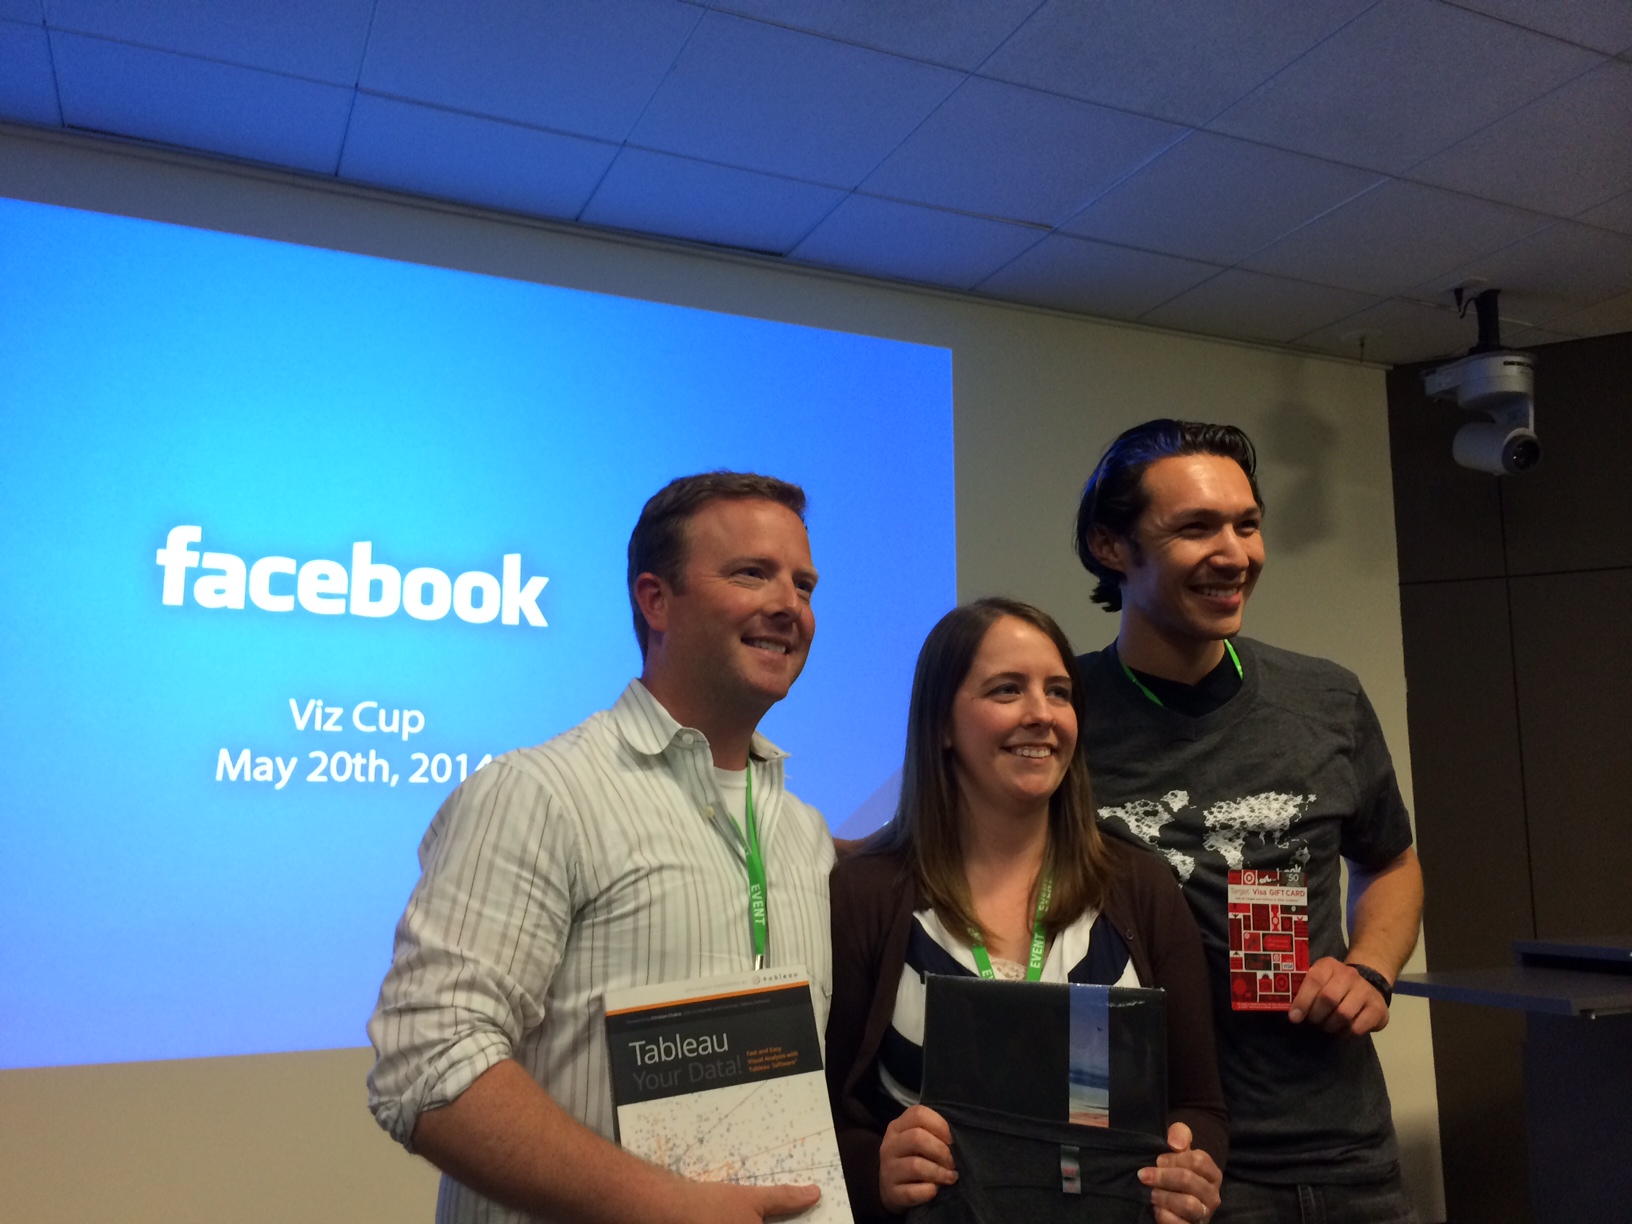
Above: The VizCup Winners with their prizes, including a copy of “Tableau Your Data!”
There were around 20 entrants for VizCup 2. All of the contestants did very nice work. Some were exceptional. The winners did an amazing presentation using the Tableau 8.2 beta release and exploiting (very effectively) its new storytelling story board feature. They clearly articulated an analysis, hypothesis and conclusion using three presenters and around eight visualizations comfortably in 60 seconds. If that doesn’t get you interested in the storytelling capabilities of Tableau 8.2, you’re not paying attention.
Again, big props to the winners: Peter So (L2F), Caitlin Donaldson (Bunchball) and Keith Conley (Bunchball). You guys did a great job!
Thank You Facebook!
I really appreciated the opportunity to visit this campus. Thank you, Zen Master Kriebel, for the invitation and the ride to my hotel after the event. If you need a judge in the future, please consider asking me again. I want to sample some more of that pig and ice cream.
For those of you looking for more great Tableau resources in addition to “Tableau Your Data!” and the InterWorks blog, be sure to check out Andy Kriebel’s VizWiz blog.
The Facebook Data Viz Team is gearing up for their second bi-annual Viz Cup. The best vizzers in the Bay Area are invited for an evening of competition, fun and a whole lot of data visualization. Judging the competition is InterWorks’ own, Dan Murray. Murray will be on hand with fellow data viz gurus and Viz Cup judges, Cole Nussbaumer and Jewel Loree to determine whose vizzes stand above the rest.
Facebook Viz Cup 2 is scheduled for May 20, 2014. The competition will be held at Facebook HQ in Menlo Park, CA. Doors open at 5 p.m. The competition starts when the clock strikes 6 p.m.
About Facebook Viz Cup
Facebook Viz Cup brings together some of the best talent in data visualization for a fun and educational competition. Competitors will design, build and share their data visualizations in front of data viz all-stars from Facebook and beyond.
Based out of Atlanta, GA, Murray serves as Director of Business Intelligence for I.T. consulting firm, InterWorks. He holds over 30 years of business experience in key roles such as CFO, CIO, COO, VP of Planning and VP of Operations. Murray maintains a reputation as a leader in the fields of data visualization and business intelligence, particularly within the Tableau community. He helped create the first Tableau User Group in the U.S., in addition to founding several others.
Milwaukee, Wis. – VizWars, an open data visualization competition, recently announced celebrity judges for the Midwest VizWars event. Among the three judges selected is InterWorks’ Director of Business Intelligence and ‘Tableau Your Data!’ author, Dan Murray. Murray brings years of data visualization expertise to the panel of judges, distinguishing himself as one of the world’s foremost Tableau gurus.
“VizWars is great because it showcases the massive amount of talent found in the data visualization community,” said Murray. “It’s exciting to see, and an honor to judge such talent.”
Midwest VizWars will be held Apr. 10, 2014 at the Harley Davidson Museum in Milwaukee, WI. Murray will judge alongside Pat McCormick, the Madison Tableau User Group Leader, and Nick Peterson, Performance Analytics Practice Director at Relationship One.
About Midwest VizWars
Midwest VizWars is an open competition to find out whom the best data visualizer are in the Upper Midwest while providing an opportunity for fun and prizes. Competitors are judged by a panel of data visualization experts. VizWars is also the official kick-off to the Business Intelligence and Predictive Analytics Symposium, hosted by AE.
Based out of Atlanta, GA, Murray serves as Director of Business Intelligence for I.T. consulting firm, InterWorks. He holds over 30 years of business experience in key roles such as CFO, CIO, COO, VP of Planning and VP of Operations. Murray maintains a reputation as a leader in the fields of data visualization and business intelligence, particularly within the Tableau community. He helped create the first Tableau User Group in the U.S., in addition to founding several others.
Stillwater, Okla. – Due to the overwhelming success of the ‘Tableau Your Data!’ book tour, InterWorks announced the addition of several new stops. The tour is ongoing, but the additional dates extend it well into the month of May.
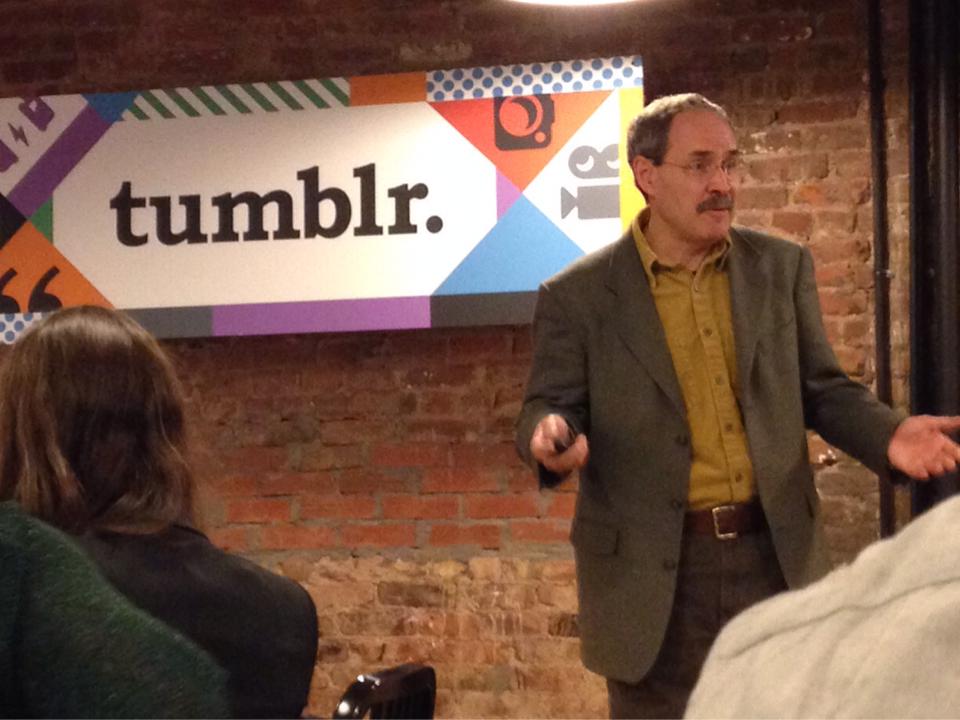
Murray speaking at Tumblr HQ.
Over the past two months, Murray spoke at several Tableau User Group meetings and similar events. He detailed his personal experiences in data as well as various topics found in his Tableau guidebook. While Murray discussed the same core concepts at each event, he tailored his presentations to fit the group he is addressing at the time. This personalized approach allows for more actionable, relevant insight across each group. Murray will continue with this format for the new events.
Below is an updated list of upcoming tour stops. To learn more, click on the event of your choosing:
Based out of Atlanta, GA, Murray serves as Director of Business Intelligence for I.T. consulting firm, InterWorks. He holds over 30 years of business experience in key roles such as CFO, CIO, COO, VP of Planning and VP of Operations. Murray maintains a reputation as a leader in the fields of data visualization and business intelligence, particularly within the Tableau community. He helped create the first Tableau User Group in the U.S., in addition to founding several others.
About InterWorks
InterWorks is a full-service, IT consulting firm specializing in data-driven business solutions. As the first Tableau Gold Partner and Tableau’s 2013 North American Partner of the Year, InterWorks boasts one of the largest and most talented teams of Tableau consultants in the world. InterWorks pairs Tableau expertise with the added benefit of being a comprehensive IT services provider. These competencies, combined with years of multi-industry experience, equips InterWorks with the tools needed to meet any data challenge today.
Dan Murray recently wrapped up his talk for the Portland TUG meeting at Nike World Headquarters. Several of our friends from Nike were in attendance and were kind enough to share some video footage of Murray’s presentation. The video cuts off towards the end, but it covers most of Murray’s presentation.
Introducing Murray was Tim Hallrud, Sr. Project Manager for North America Nike Tech. Hallrud had some incredibly nice things to say about Murray and InterWorks in his introduction.
“Nike uses a firm called, InterWorks that may have some of the smartest Tableau people around. They’ve been doing it for longer than virtually any other consultant. We have James (Wright) who works here at Nike, essentially our InterWorks representative. He really helps us adopt this through the enterprise, promote best practices, he does teaching; so we’re very lucky. Then we have Dan, who came all the way from Atlanta just to present out here. This (He) is among the best resources you can ever ask to answer your questions.”
Speech Overview
Each presentation Murray gives covers the same base material, but it is tailored differently to each group he visits. Major talking points included:
My first Tableau project
The data flood
Being an evangelist/getting buy-in
Deployment strategies
Building effective dashboards
My First Tableau Project
Murray talked about his first interactions with data with his previous employer, Blastrac. He discussed his search for data solutions and just how expensive and labor intensive some of them could be. One day, he ran into some books on visual analytics by Stephen Few. Few directed Murray to try out a trial of data visualization software from Seattle-based software company, Tableau Software. In 2007, Murray began his journey in Tableau.
Murray was able to do things in a free, trial version of Tableau in one weekend that would have taken him months and millions of dollars to achieve elsewise. From that moment, Murray was sold on Tableau. As Murray began using Tableau more and more, he was eventually asked to speak about his experiences at a Tableau event. Afterwards, hundreds of people came up to him to ask him about Tableau. He began to consider the possibility of doing this for a living. Murray thought consulting would be fun, and decided to leave his job and begin independent consulting. After a few months, Murray joined data consulting firm, InterWorks to continue his Tableau consulting journey. The rest is history.
Through his experiences, Murray learned three important things about Tableau and its value:
Start quickly
Spreadsheet work
Fast payback
Murray realized, “Everybody needs this tool, they just don’t know yet.”
The Data Flood
Murray covered the latest in Big Data and Tableau. Murray went on to discuss just how valuable data has become to so many people, especially government agencies like the NSA. In reference to just how big data has become, Murray provided an illustration:
“It would take 462,170,217 1 TB drives to store all the data that has been produced from the beginning of this year to Jan. 28. That’s $1.32 billion worth of MacBook Pros with 1 TB drives.”
He went on to explain that only 1% of this data is analyzed.
“We’re pack rats. We don’t even know what it is we’re going to do with this data, we just store it like a squirrel digging holes for acorns. Then we figure out later whether or not we’re going to use it, kind of like a squirrel randomly searching through a massive pile.”
He allowed that storage capabilities are keeping with this volume of data. The next step is ramping up analysis.
Murray offered a two part solution to this situation. The first part involves the use of tools like Tableau to help analyze these massive amounts of data. The second part is the skill and knowledge of the people using those tools.
Being an Evangelist / Getting Buy-In
Murray outlined the problems that many Tableau users have in trying to get others using the software. It can be the most challenging aspect in enterprise adoption. Murray instructed everyone to “talk less, do more.”
Murray explained how he started the very first Tableau User Group, along with two others. His mission was to get data people speaking publicly in a way that everyone could understand. At each meeting, they would break off into teams to solve certain problems. Then they would make the most frightened person present the results in front of the entire group. Murray stressed the importance of clear communication and proactive effort in getting people to buy into Tableau.
Key advice he gave included:
Move quickly
Make a compelling story
Show the something they haven’t seen
Deployment Strategies
Murray recounted how several companies asked him about specific methodologies in deploying tools like Tableau, to which he would respond:
“There isn’t one. It’s very cultural dependent. How far are you willing to go and how fast?”
Murray continued by comparing and contrasting the very different cultures of Facebook and Cisco in implementing Tableau. Facebook was very bold and willing to take risks. They went from 0 to 500 Tableau Desktop licenses in a short amount of time. Inversely, Cisco took a more reserved approach. They took more time and leveraging in order to implement Tableau across the organization. Both have had great success in Tableau despite their different cultures.
Building Effective Dashboards
Here, Murray went directly into Chapter 8 of “Tableau Your Data!” to explain dashboard best practices. Murray expressed the importance of design with elements such as fonts, color, context, use of tool tips and filtering. He also painted a broader picture in his explanation of how to build dashboards that appeal to people’s natural inclinations and sense of visualization.
Put simply, he stated a dashboard should:
Fit available space
Load quickly
Be easy to understand
He went on to compliment Nike’s dashboard design, claiming “it’s just about some of the best work I’ve seen in the world.”
Murray’s talk at Nike was one of many he’s given across the country over the past few months. Each is unique in its own right, but offers the same core advice and lessons that can be applied to anyone interested in data analysis. Murray is still continuing his “Tableau Your Data!” tour, with several events remaining.
Tableau Your Data! author Dan Murray shares his tour experiences so far…
I’m writing this from my brother-in-law’s home in West Milford, NJ. It’s a welcome break from hotel rooms. This afternoon and evening I’m looking forward to giving another speech to the New York Tableau User Group.
Spending the last few months speaking at Tableau User Groups (TUG) in Omaha, Chattanooga, Indianapolis, Raleigh, Minneapolis, Madison, Milwaukee and Boston, I’ve met many new Tableau users and Tableau partners. It’s been an interesting experience, so I thought I’d share a few thoughts about the people, places and things I’ve seen.
The People
Tableau’s reach is spanning a very wide number of industries as well as education and government. In Minneapolis, I counted (24) different industries and all of them are getting a lot of value from Tableau and data visualization. There is a sort of user “cult” that is growing in size while maintaining the enthusiasm of the very early days of Tableau. This is exciting!
Above: Indianapolis TUG
The Places
My talks in Omaha and Chattanooga were in Nov. and Dec. Thankfully, I missed the cold in those locations. January has been severe. When I woke up in Minneapolis last week, the outdoor temperature, sans wind-chill, was 15-below-zero. Since I’ve never felt that kind of cold before, I decided to go outside immediately after my morning workout to see how long it would take for steam to appear over my head. I didn’t find out. After about ten seconds, I went back into the hotel. Later that day I purchased a stocking cap because my ears felt numb.
Above: The road from Minneapolis to Madison
Above: My reflection from the BCBSNC building.
Things
In most locations, I’ve been speaking as part of Tableau User Group meetings. Having been involved in starting three different user groups, I really enjoy the experience of seeing how other groups are organizing meetings. Most notable so far have been the Madison, WI meeting (organized by Pat McCormick) and the Boston meeting at the Broad Institute in Cambridge, MA.
Above: Boston TUG
Above: Freezing, but happy in Madison
I know how much time it takes to organize user group sessions. Pat’s meeting ran almost like a small conference. There were Tableau problems to solve, free book giveaways from three different authors, my talk and then a session grouping members into teams to work on Tableau visualizations and present the work done. We have used this method in Atlanta with great results. I’m happy to see other groups doing the same thing.
The meeting at the Broad Institute this week included another speech by Nicole Nichols and Josiah Grimes of the New England Biolab which was fascinating. They use Tableau to improve the quantity and quality of data analysis related to DNA Polymerase development.
I’ve worked with a lot of different kinds of data using Tableau, but I’ve never seen this kind of analysis before. In fact, at nearly every session that I’ve attended at Tableau User Groups, I have learned some new technique or usage of Tableau. I’ve been doing Tableau consulting for nearly seven years, so that’s saying something.
Presentation Slides and Upcoming Events
In case you are curious about the agenda I cover at each talk, here is my slide deck:
If you are interested in hearing my speech, please check the event schedule.
More dates are sure to be added to this list in the coming weeks, so check back often if you don’t see a TUG meeting in your area.
Today I’ll be in Manhattan speaking from 5 p.m. to 8 p.m. EST. During the next few weeks, I’ll be crisscrossing the USA a couple more times from San Diego to Seattle and Nashville to Pittsburgh. The Paris Tableau User Group has contacted me and we’re trying to put together a speaking tour in a few European cities this summer. A couple of weeks ago a book publisher in China emailed me about acquiring the rights to publish “Tableau your Data!” in simplified Chinese.
It’s becoming a Tableau world. I hope to see you all at an event near you!
During the past seven years we’ve accumulated a considerable amount of experience working on Tableau deployments in nearly every major vertical market. Some of those clients had no knowledge of data visualization best practices, database architecture, or SQL–but they saw a “very cool” demonstration of Tableau in action and felt it could help them make more informed decision.
Clients sometimes have a very precisely defined project deliverables. Being precise about project objectives and desired outcomes is good but defining rigid styles of presenting the can result in dashboards and visualizations that don’t fully utilize Tableau’s capabilities. This happens when clients embark on a project before they have an understanding of the tool.
The goal of writing Tableau Your Data! was to provide new Tableau users with a reference book including introductory, intermediate, and selected advanced topics covering Tableau Desktop and Tableau Server. Best practices are discussed and examples are provided that take you step-by-step through each technique. We’ve includes a detailed function reference with code samples and explanations. In addition, case studies highlight use cases that may provide additional insight.
Because Tableau Software provides major new releases every 12-15 months–and does significant maintenance releases that provide enhanced capabilities even more frequently–the book’s companion website will highlight these changes and provide examples of new features. The companion website also includes sample materials that will help you work through the examples contained in the book.
You can effectively use Tableau in hours. Proficiency can be achieved in days. Advanced mastery requires additional time. I hope you find that Tableau Your Data! reduces your time for success for each stage of you and your team’s progression to mastery.